Tag Archives: alternative

Be A Value Investor Without Doing The Work: The Magic Formula

The Magic Formula from Joel Greenblatt’s Little Book That Beats the Market sounds like a cheap gimmick, but is in fact a robust value investing strategy. When individuals implement the Magic Formula in a disciplined way, they buy above-average companies at below-average prices, which is by definition value investing. The only way to succeed with the Magic Formula is to avoid behavioral bias. That means following the strategy in a rote and mechanical way, with no tweaking. You have to stick with it! Most investors can’t, which is actually why the Magic Formula will continue to work. Despite the recent availability of Magic Formula alternatives (including from Joel Greenblatt himself), the simple Magic Formula, applied strictly mechanically, remains compelling for disciplined long-term investors. Do you want to be a value investor but have no idea how to read financial statements? Or maybe you just don’t have the time to do your own proprietary research. Fear not! The Magic Formula will do it all for you. OK – it all, down to the name of the strategy, sounds very, very suspicious. I know it turned me off immediately when I first saw it. It’s the same reaction I had when I saw the title of Joel Greenblatt’s book describing the Magic Formula, The Little Book That Beats the Market (or as it’s now known, The Little Book That Still Beats the Market ). It sounds almost as bad as his other big book, You Can Be a Stock Market Genius . (Of course, that book somehow managed to launch a fleet of a thousand hedge fund manager careers, after the same methods made Greenblatt many millions of dollars personally.) But consider this. This stigma associated with the name the Magic Formula is actually a huge boon to anyone that cares to practice the Magic Formula! To look at why, we need to go back to the very definition of what the Magic Formula is. “The magic formula tries to buy those companies that provide the best combination of being both cheap and good.” – Joel Greenblatt, The Little Book That Still Beats the Market , Afterword to the 2010 Edition As Joel Greenblatt said both in the book and in almost every interview since then, the Magic Formula is a thought experiment – what results would you get if you tried to buy stocks that were cheap, Benjamin Graham style, but also good, Warren Buffett style? As the Magic Formula is an abstract thought experiment, the parameters of “cheap” and “good” are both simplified. “Cheap” is taken to mean that a company, compared to other companies, trades at a price that is cheap price compared to its earnings. But instead of using the simple price to earnings ratio, Joel Greenblatt’s Magic Formula instead uses the adjusted metric of EBIT/Enterprise Value. “Good” is taken to mean that a company, compared to other companies, can reinvest its money at higher rates of return. The adjusted metric that the Magic Formula uses to calculate this is EBIT/(Net Working Capital + Net Fixed Assets). The Magic Formula ranks the stocks in the market by how cheap they are, ranks them by how good they are, and then combines these rankings to get an ordering of how cheap and good each stock is. Put even more simply, the Magic Formula is a way to systematically buy companies that are priced at less than they are worth. That’s value investing. The good thing about the Magic Formula is that it does this for you. Even better, you don’t actually have to run the screens yourself (although you can if you want to). Just go to magicformulainvesting.com /, create a free account, and the computer will spit out a list of stocks (US stocks excluding ADRs and financial and utilities stocks, for which it is not appropriate to use the Magic Formula criterion) for you. You then simply buy a few stocks from this list every month, and hold each stock for about a year (give or take a day for tax-loss harvesting). That’s how little work you need to put in this. Oh? And the returns…they’re quite good. In The Little Book That Still Beats the Market , Joel Greenblatt reported that the Magic Formula applied to stocks over $50 million from 1988 to 2009 returned a total of 23.8% annualized. By comparison, the S&P returned a total of 9.5% annualized over that same period. You can see the performance of the Magic Formula since then at third-party sites unconnected with Joel Greenblatt (so the methodology in calculating return – which is complex, may not be exactly the same). But this article won’t focus on the returns. If you want to research those, there are a lot of third-party sources that let you look into more details on that. This is an article on how to be a value investor by using the Magic Formula. And being a value investor is about having the correct process, not on chasing recent good performance. So if the Magic Formula is so great, why hasn’t everyone done it? What is it about the process that makes it so good, and yet so rare? And we all know that one of the iron rules of finance is that good ideas tend to be arbitraged away. Why hasn’t the Magic Formula suffered the same fate? A few reasons: 1. The stocks that the Magic Formula highlights tend to be cheap for obvious reasons. Many are heavily shorted and hated. Stocks that are cheap despite being quantitatively good tend to be so because of serious headline risk or other “ick” factors. 2. The Magic Formula works for the same reason that value investing itself works – that is to say, it doesn’t work all the time and it takes time, and in today’s impatient and recent-past-performance oriented market, this opportunity does not get fully arbitraged away. And the results are quite volatile. There will be many down months and in fact many down years and many months and years of underperformance as well. 3. The Magic Formula is robust, meaning that not only does the top ten percent of stocks as ranked by the Magic Formula outperform the other stocks, but the second best ten percent performs all the ones below it, the third best ten percent performs all the ones below it in turn, and so on, to the very worst ten percent. So it is naturally hard to arbitrage away. 4. It’s very unsexy. You won’t impress any of your friends by saying you beat the market by mechanically applying someone else’s formula from a book published in 2010. You won’t get a job in equity research or as a hedge fund analyst by talking about your personal portfolio which was invested mechanically in the Magic Formula. 5. And most importantly, going back to the original point – the very name of the Magic Formula is repellent to people! And the process is, too. People either want to use their judgment to pick stocks, or they want to just set and forget a regular monthly contribution to a fixed asset allocation across index funds. So the Magic Formula will never catch on. The whole thing has an ick factor. And that’s very beneficial to people who actually stick with it. The less people do it, the stronger it is. But although it works, you don’t hear a lot of stories of people getting rich with the Magic Formula. Why? The strongest reason is our human behavioral flaws. There’s something weird about the human tendency to ruin a good thing. Tobias Carlisle and Wesley Gray wrote about a strange phenomenon in their recent book Quantitative Value . Study after study in fields as different from finance as medical diagnosis have shown that even expert judgment tends to detract from the performance of a good model. That is to say, models do worse when you add human judgment, even if it’s the judgment of an expert! The same is true in investing, and especially so for the Magic Formula. Joel Greenblatt said it himself in an online column (referring to an experiment where a partner company set up accounts to let people either pick Magic Formula stocks themselves out of a defined list, or just do the picking for them, randomly): Well, as it turns out, the self-managed accounts, where clients could choose their own stocks from the pre-approved list and then follow (or not) our guidelines for trading the stocks at fixed intervals didn’t do too badly. A compilation of all self-managed accounts for the two year period showed a cumulative return of 59.4% after all expenses. Pretty darn good, right? Unfortunately, the S&P 500 during the same period was actually up 62.7%. “Hmmm….that’s interesting”, you say (or I’ll say it for you, it works either way), “so how did the ‘professionally managed’ accounts do during the same period?” Well, a compilation of all the “professionally managed” accounts earned 84.1% after all expenses over the same two years, beating the “self managed” by almost 25% (and the S&P by well over 20%). For just a two year period, that’s a huge difference! It’s especially huge since both “self-managed” and “professionally managed” chose investments from the same list of stocks and supposedly followed the same basic game plan. Let’s put it another way: on average the people who “self-managed” their accounts took a winning system and used their judgment to unintentionally eliminate all the outperformance and then some! – Joel Greenblatt, 2012 What tends to happen is this. The Magic Formula will give you a list of stocks to choose from. Most people will exercise their judgment and pick the stocks that look the safest or the most promising out of the list. They’ll purposely avoid the ugliest looking companies that they just know will lose money. And what will happen is that the stocks that tended to look the best will actually perform the worst, and the stocks that looked the worst will perform the best. And by doing so, they’ll drain all the outperformance out of the Magic Formula, and in fact end up not even performing as well as if they had simply bought an index fund! So I can say with certainty that you shouldn’t do that. I can give some personal examples out of my own Magic Formula portfolio. Chicago Bridge & Iron (NYSE: CBI ) looked like a great pick when I bought it in July 2014. (I exercised no judgment when I bought the stock. I bought it because it showed up on the relevant Magic Formula list for me.) It was a big holding at Berkshire Hathaway for good measure, picked either by Warren Buffett himself, or Ted Weschler or Todd Combs. One of those super stock pickers had decided this was a great stock to own. Even H. Kevin Byun of Denali Investors, one of Joel Greenblatt’s best students, was behind this stock! As of the writing of this article, it’s down over 30% from my cost basis, excluding dividends. And it could turn out to be a permanent impairment of capital, depending on what happens in the world. On the other hand, Ebix (NASDAQ: EBIX ) looked like a terrible pick when I bought it in August 2014 (Again, I exercised no discretion in picking the stock, but bought it merely because it showed up on the Magic Formula list.) The stock was extremely heavily shorted, and I think I had to put in a special verification code at my broker when buying it, so heavy was the stigma. As of the writing of this article, it’s up over 45% from my cost basis, excluding dividends, and could go higher still. A few tips for implementing the Magic Formula without style drift due to behavioral error: 1. Decide on a fixed asset allocation to the Magic Formula, and then stick with it, by putting the same dollar amount into the Magic Formula every month. Don’t chase returns by putting money in when the Magic Formula has done well in the last few months, and then not putting money in when the Magic Formula underperforms the market. Beware of self-deception in coming up with reasons not to stick to the exact rules. 2. Don’t time the market. Concretely, this means making your contributions regularly rather than according to your whim or any other market-timing factors. And it also means sticking to the rules of holding each stock for one year (give or take one day, for tax-loss harvesting purposes), no more, no less, regardless of how good or bad the stock looks at any given point of time during your holding period. 3. Pick stocks completely randomly from the Magic Formula list, and resist the urge to “just this once” selectively buy or not buy a stock, no matter how great your knowledge on that specific company. This goes back to the point expressed in Quantitative Value about even experts detracting rather than adding value to a good model, which is what the Magic Formula is. The last point is the most important, and the hardest to stick with. You will end up buying a lot of stocks that look like value traps, and a lot of those stocks will in fact be value traps. My portfolio currently has Gamestop (NYSE: GME ), among other companies that everyone knows are obsolete, Herbalife (NYSE: HLF ), among other companies that everyone knows are “frauds” and King Digital Entertainment (NYSE: KING ), among other companies that everyone knows have past earnings that are unsustainable in the future. All of these stocks may in fact end up as losses. But implementing the Magic Formula means trusting that on the whole, taken across a diversified portfolio of Magic Formula stocks, and over a long period of time, because of the systematic underpricing by the market of these statistically cheap and good companies, the losers will be made up for by the winners. And because we trust in the power of a proven model over human judgment, which we know to be flawed, we know that throwing out or throwing in stocks to your Magic Formula portfolio will on the whole detract from the portfolio’s returns. The easiest way to fail, and ironically what happens to almost everyone who tries the Magic Formula, is that they just cannot stick with it in a systematic way (just Google “Magic Formula blog.” You’ll find many who a retail investor who tried to be a Magic Formula investor but just could not stick with it or ended up making their own little tweaks that killed their returns). In fact, the failure rate was so high that Joel Greenblatt – who doesn’t exactly need the money after making millions as a special situations hedge fund manager – opened a set of mutual funds called the Formula Funds that did the Magic Formula for you. But then that didn’t work out either because people could not handle the volatility. So then he closed those funds and opened a series of mutual funds called the Gotham Funds that do a sort of modified Magic Formula, but that short expensive stocks as well to lower the volatility. You can invest in those if you’d like. But to be honest, the fees are pretty high. And if you can handle volatility, you should just do the Magic Formula by yourself. After all, Joel Greenblatt keeps on paying the hosting fees for magicformulainvesting.com/, and keeps on standing by the Magic Formula in interviews. And if you want to hedge your market exposure, you can always just buy S&P 500 put options or futures. So although the secret is out, it’s as if it isn’t. After all, value investing itself hasn’t exactly been a secret for a very long time, and yet it continues to work. So if you are the rare person who can stick to the Magic Formula, you will end up beating the market over the long run. That’s what will happen if you buy stocks that are both cheaper than the market and better than the market. That’s what long-term value investing is. Sticking to a process that you know works. And the process here intuitively makes sense. By following the Magic Formula, you are basically making your own mini index fund. But it’s better than a typical market-capitalization-weighted index fund that you might buy from Vanguard. Instead of being weighted towards the biggest companies, which may be overpriced compared to their intrinsic value, your mini-index fund that is your Magic Formula asset allocation is equally weighted among a set of companies that are both the cheapest and the best. You can’t not do better than the market in the long run (although you will have months and years of underperformance which cause most people to quit, and thus which allow the anomaly to continue to exist) with such an approach. You are buying better businesses that are also cheaper. And if you believe in the principles of value investing, you know that the return from investing comes from a combination of the underlying businesses you buy and the prices you pay for them. So you will beat the market, and you will do it by value investing. Yet somehow, you can avoid doing any of the hard work usually involved. Just don’t talk about it to your friends, family, and on forums. You’ll be derided for using a “Magic Formula” and reading a “Little Book That Beats the Market.” But that’s good. It means less competition for you, and that’s why the Magic Formula will continue to be a compelling investment methodology going forward. P.S. One downside of using magicformulainvesting.com /, which is after all free, is that the site does not retain historical data. Thankfully, some third parties have stepped up that task. The best I’ve seen are www.magicdiligence.com /, which provides summaries of the Magic Formula’s performance each year since 2009, so you can see how the Magic Formula performed since the book’s publication, and www.dusthimer.net/Magic-Formula-Data.html , which has collected the monthly Magic Formula picks as reported by the website, so you can play around with the data yourself. But I personally don’t recommend playing around with the data too much here. You’ll get tempted to add a variable or ten and ruin a simple good thing, as most have. Additional disclosure: The author’s personal portfolio has a substantial portion allocated to a strictly mechanical Magic Formula strategy.
Spark Energy’s Income Statement Is In For Some Pain

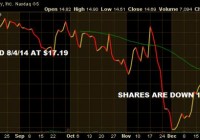
I’m taking my losses and selling SPKE before Q4 earnings. SPKE has abandoned its plan to increase spending to acquire customers and has now doomed its income statement. SPKE’s model isn’t built for constant shifting between high and low spending and this will create many problems. In hindsight I always knew what Spark Energy (NASDAQ: SPKE ) was, and I detailed that in my initiation article, so maybe I shouldn’t be as disappointed in how this trade turned out as I am, because I’m actually really disappointed. I’m selling SPKE on Monday at the open down 14.5% or so (depending on where this stock opens) for a couple reasons but primarily because the company has no idea what it’s doing. It’s literally operating in an industry where all you have to do is spend endlessly to acquire customers (welcome to the S&M black hole!), pray that you can do a decent job at hedging exposure to natural gas (creating the spread that creates the margin), do a good enough job to hang on to the majority of customers (but trust that there will in fact be churn), hope the share price goes higher, raise debt or finance via equity offering, and repeat the process. The most important must-do by far of those listed is spend, by the way. That’s all you have to do. Heck, I’ll make it even simpler for you SPKE – use your new revolver, yeah the one with the $37.9 million in current borrowing availability and go acquire customers. It’s that easy. Just spend, spend, spend! What do you not get about that? (click to enlarge) But of course, SPKE management couldn’t do that. No, SPKE management just announced on the Q3 CC that it’s executing its third strategic shift in as many years. What is this shift I speak of? Well, I’m speaking of the shift to (again) lower customer acquisition spending (this is after ramping customer acquisition spending in mid-2013 after lowering it in early-2012) to focus on “the longer-term sustainable growth consistent with our focus on distributable cash flow (SOURCE: SPKE Q3 CC )”, whatever that means. I say whatever-that-means because there’s nothing “longer-term” about SPKE’s business. It’s a commodity of the worst variety, meaning it has zero differentiation from competitors and zero value-prop to customers other than at any given point it can offer electricity services at a cheaper price than its competitors, which is by definition the definition of a commoditized business. This is pretty well evidenced in the attrition SPKE experiences regularly. I mean consider this, SPKE spent to acquire 91,000 customers between Q2 and Q3 while at the same time 44,000 customers walked through the door on the way to the next commoditized provider: (click to enlarge) Talk about an inefficient model. Now getting back to the stated reduction in spending and focus shift, this becomes a big problem because every time SPKE drops customer acquisition spending, as they did in FY2012, SPKE sees its revenues fall off a cliff. I’ve detailed this in SPKE’s financials in previous articles and even promoted this as a reason that “value” existed in buying the shares when I did. Of course this was under the assumption that management would actually do what it said it was going to do at the time I bought shares, which was spend, spend, spend. I only bought these shares because I wanted to piggy back on the ramped spending and the fact that the spending costs (customer acquisition costs) get recorded as an asset on the balance sheet and accounted for through D&A over 8 quarters. I wanted to front-run the what should have been explosive top-line growth with what would have been for a while minimal D&A additions to the income statement. This would have artificially enhanced the income statement and I was hoping propped the stock to a point that I could have sold at a healthy gain all while collecting a fat dividend for waiting. Yeah, it didn’t exactly turn out as planned. So, here we are with today’s “new model” that SPKE is promoting as the way of the future. Forget that the company has a horrible looking S-1 filing with three years of volatile financials and that the company has zero history of being able to execute on any single strategic initiative for more than a quarter or two. Don’t mind that. Let’s just get long some shares because, well, this is the way of the future. This is the “longer-term” more “sustainable” way to run this commoditized business. I think SPKE thinks it’s something it’s not and that can be a very dangerous thing. It has been for bagholders in the past and has been for this bagholder through 5 five months of ownership. The Ramp UP and The Ramp DOWN SPKE’s creating huge financial volatility for itself by constantly ramping up and ramping down spending. It’s also creating volatility for itself in not having a focused approach to its S&M efforts. SPKE also noted on its Q3 CC that it’s shifting its focus again back to commercial accounts, something it had completely abandoned after focusing on several years ago. You see a pattern here? SPKE seems to always be chasing the “hot dot” of the moment and seems to be the real case of the tail wagging the dog. Take a look at what it’s done for the income statement: (click to enlarge) So, first things first SPKE’s 9M results are absolutely blown up because 1H/14 was blown up by spending not being ramped until Q3/13. Let me explain how that works. SPKE can easily track revenues growth with S&M spending growth. What it can show is that once it increases spending, roughly three months into elevated spend levels revenue growth begins to turn upward. After about six months revenue growth reaches a terminal velocity where more spend is needed to created more velocity. That’s a pretty easy equation to follow. Now, I don’t know if that is uniform in this space or not but that’s what SPKE’s history has shown us. When SPKE decided to increase S&M spend in Q3/13 that means Q1/14 was only seeing terminal velocity of the initial increases in spend levels (which were increased from there further) and in fact the spend was being spread across larger geographic areas. This means that velocity was lower across a wider casted net which means sales were lower than they could have been had SPKE simply been concentrated (further saturating an area with spend). Yet another misstep. Regardless, that explains the 9M results showing such a variance from the Q3 results. Oh, by the way, we’re heading back to the days of reduced spending but don’t worry things are going to be different this time around because management has a plan. The 9M/14 results show flat top-line results, better NAO revenues (which are basically hedging gains or losses and largely SPKE has shown it has zero control and/or predictability in this line item), much higher operating expenses, and growing operating and net losses. This is inclusive of the benefit of a lower D&A expense, which will slowly be getting bigger quarter after quarter for the next six quarters before shrinking assuming SPKE actually maintains its plan to lower spending. There’s a huge amount of customer acquisition costs that have to be D&A’d to the income statement from the previous quarters spending ramps, regardless of if SPKE abandons the strategy half way through. What drove the 9M and quarterly results? S&M spending and hedging. That’s the entire business here folks. There’s a guy knocking on your door or a flyer in your mail offering you electric service. Is it at a lower cost or not? That’s what drives SPKE’s income statement. It’s really not that complicated but somehow SPKE has found a way to complicate it. What’s really sad is that had SPKE just stayed the course it might have been able to finally hit a vein regionally that it had some traction with or find a market that actually responded to its spending. I mean the cash is already gone, why not actually use what’s left on the balance sheet and dip into the revolver? Everything outlined in red is bad. The entire income statement is bad. I mean just look at that net income destruction Y/Y from ~$12 million to ~$7 million. Now, I’ll give SPKE that it hadn’t had a full 9M to show its increased spending and larger customer base within the 9M/14 figure, and subsequently SPKE went out and acquired some customers from outside sources so at least it’s trying the M&A route, but the comps it was up against in 2014 weren’t tough considering it didn’t ramp 2013 spending until Q3 as well. I just don’t have any sympathy for SPKE’s financials at this point because it’s doing this to itself. SPKE’s Adjusted EBITDA really shows the customer acquisition cost spend differential and why I say that once you start spending in this model you have to continue to spend forever, that the model basically becomes a constant black hole of S&M dollars: (click to enlarge) You can see how I’ve outlined the massive difference in customer acquisition costs in the comparable periods. In Q3/14 it was roughly 400% Q3/13, you don’t think that should have been driving revenues? You don’t think the ramp from previous quarters should have been driving revenues? The fact that the Q3 income statement showed flat revenues Y/Y in Q3/14 is a clear sign that the ship is already starting to take on water. That ramped spending is about to start to really add up on the income statement over the next few quarters in the form of a D&A uptick and SPKE isn’t going to have the revenues to offset it. It’s going to be taking huge losses on that when it happens. The spending difference becomes pretty egregious on the 9M side of the Adjusted EBITDA. 9M/14 customer acquisition costs were roughly 700% 9M/13 spending. Even with that, even with the compounding spending that should have reached maximum velocity from quarter prior SPKE still posted flat revenues. What an absolute disaster. This is going to bury SPKE’s stock over the next few quarters and was something I outlined in my prior articles. If SPKE didn’t have consecutive and sequential blowout top-line growth quarters you want nothing to do with this company. It won’t have the top-line to make up for the D&A uptick. That in a nutshell explains the bear thesis around this name going forward. This stock is dead, it just doesn’t know it yet. Do I need to even note those Adjusted EBITDA figures? Didn’t think so. Now, you can imagine what these types of operations have done for cash flows, which actually account for the cash outflows of the customer acquisition costs as they are incurred: (click to enlarge) Yeah, the cash from operations has been blown up and maybe that’s the reason for the strategy shift towards lower spending. Maybe SPKE management saw that what they were doing (again) wasn’t working and decided that conserving the last of the cash and the last of the liquidity via the revolver was the primary concern. I mean to hell with the income statement, that’s just for accounting nerds, the cash flow statement is dealing in real dollars, actual cash and when you run out of that and still don’t have a plan on the board for how you turn the corner and make it to spring you don’t get to play anymore. Even at minimal levels of revenues if SPKE can get spending down low enough it can generate good levels of FCF. Just look at both of these periods listed here. Solid FCF could allow the company to rebuild its cash balances and make one more run at another strategy shift or whatever else the company might have in mind. The point is, just don’t run out of cash. I think that’s probably the best explanation I have for what’s been announced and what’s about to be allowed to happen to the incomes statement. Where’s the trade? The trade is to sell SPKE and don’t ever consider it on the long side again. This business model and this niche isn’t one that you want to invest in for all the reasons mentioned in the beginning of this article. It’s a commodity with no way to differentiate itself and no way to protect itself from the wide swings that come with trying to hedge energy exposure on a constantly fluctuating demand. SPKE always was a bad business but I thought I could catch a few cheap points riding an accounting loophole that would have allowed revenue to grow while expenses remained artificially low on the income statement. I was wrong and lesson learned. I recommend a sell of SPKE. I look forward to providing continuing coverage in the future. Good luck to all.

Using ESG Screens For Utilities Stock Selection: American Electric Power Comes Out Ahead

Summary AEP comes out as the top pick after fundamental analysis and ESG screening. AEP’s fundamental and ESG scores were impressive in comparison to the rest of the sector. Since August 2014, its stock has performed admirably. Environmental, social, and governance (ESG) screening strategies can find alpha in innovative companies. Utilities fit well into this analysis and screening methodology. Last July, while looking for an investment opportunity, I recalled New York City’s legendary summer blackouts. During those fateful evenings in August 1959, July 1977, and August 2003, the city’s electric utility, Con Edison, played a feature role in the events that were retold by patrons for decades. While Con Edison worked feverishly to restore power to the city, New Yorkers took off their shirts and wrung out their sweat-soaked handkerchiefs while sitting on their stoops, balconies, and porches waiting for a cool breeze from the East River. With this picture, I decided to explore the utilities sector for an investment opportunity. Utilities have been favored by investors for dividend yields and capital preservation. Many utilities are under-covered by securities analysts and as such, price discovery and liquidity are potentially hampered, creating potential long-term investment opportunities according to Target Rock Advisors, a socially responsible investing (SRI) consulting company focused on the utilities sector. I am an SRI champion so I began my sector analysis by applying an Environmental, Social, and Governance (ESG) screen. Afterwards, I look at fundamentals. Since I am investing for the long term and income, ESG screening is a sensible starting place. I used the Thomson Reuters Corporate Responsibility Ratings (TRCR) ESG Port for my first screen. The TRCR dataset allowed me to extract the U.S. utilities sector comprised of electric utilities, multiline utilities, natural gas utilities, and water & other utilities. My objective was to find the top performing utilities while applying an ESG tilt. The database is built to allow investment managers to select companies using a “best in class” measure, forgoing the alternative of ethical exclusions also called “negative screening”. This process presented me with the top ESG performers in the utilities sector. I retrieved 47 companies in all. Each company has four scores: an Environmental Score, a Social Score, a Corporate Governance score, and a composite ESG score which is the average of the three. The scores range from 1 to 100. Rather than simply ranking the companies by their composite ESG scores, I applied a weighted screen having greater leverage on the Social and Governance Pillars. Utilities are indubitably joined-up with environmental matters and actively comply with compulsory environmental regulations. To a large extent, utilities have recognized their environmental risks–so I reasoned that these risks have been priced into their stocks (with the exception of a “black swan” event). This relegated Environmental Scores to a lower weighting by my design. High Corporate Governance Scores are typically accepted as an indicator of strong corporate performance and lower risk since they are indicative of the company’s good management, strong board structure, as well as corporate charters and bylaws that are favorable to shareholders. Additionally, as a regulated industry, compulsory reporting assures transparency, another component of strong corporate governance scores. Clearly, “a strong governance rating would be a better long term indicator of stock market performance versus a strong environmental rating” according to Richard Rudden of Target Rock. Well managed companies have long term horizons that bode well for economic sustainability. A utility’s Social Score is perhaps the most revealing ESG indicator and the best place to look for an investment advantage, assuming that there is an accompanying strong corporate governance score. Social scores have key performance indicators for Employment Quality, Health & Safety, Training & Development, Diversity, Human Rights, Product Responsibility and Community Involvement. In Target Rock Advisor’s words, “Utilities have an abiding interest in supporting local and regional health and economic development, since those areas represent their core markets.” In effect, utilities are joined by the hip to the markets that they serve. Economic Analysis The final decision comes after a proper economic analysis. To do this I used MarketGrade.com’s StockGrader tool. StockGrader applies a fundamental analysis to companies and grades them in a range of 1 to 100. It uses technology to analyze a public company’s financial statement and presents the results in a user-friendly format. According to StockGrader, AEP distributed dividends uninterrupted for at least five years and based on the latest payout the stock was yielding 3.80%. The company was showing accelerating margin growth over the last three quarters and profits grew very strongly from the previous quarter compared to a year prior plus full year net income showed healthy gains from three years ago. Their latest report also showed a remarkable 20.68% increase from its total sales recorded during the same quarter last year. From a valuation perspective, the company’s current market value is only 1.56 times its tangible book value, which excludes intangible assets such as goodwill. This, according to StockGrader means investors are currently assigning very little value to the company’s ongoing business and that its future earnings growth when combined with AEP’s market cap of $25.53 billion (which is only 7.31 times larger than its latest quarterly net income plus depreciation), seems like an attractive valuation. My Analysis Steps Here is an outline of my analysis. 1. Create a portfolio of companies in the utilities sector with Thomson Reuters Corporate Responsibility Ratings (TRCR). 2. Screen for the top performers in the Social pillar with TRCR. Tag the top ten performers. 3. Screen for the top performers in the Governance pillar with TRCR. Tag the top ten performers. 4. Identify the companies that are in both top ten performer groups. This revealed the following companies: American Water Works (NYSE: AWK ) Xcel Energy (NYSE: XEL ) Exelon Corp. (NYSE: EXC ) American Electric Power (NYSE: AEP ) 5. Access StockGrader for economic ratings as a method of performing my fundamental analysis. 6. Select the company that presents the best combination of these metrics. Top Companies Scoring Table Company EN Rating SO Rating CG Rating ESG Rating ESG Rank Market Grader Rating Market Grader Action American Water Works Company Inc 63.4 66.2 73.7 67.8 86.3 49.7 Sell Xcel Energy Inc 70.0 70.7 72.9 71.2 91.4 43.8 Sell Exelon Corporation 70.6 78.0 71.8 73.4 94.4 37.0 Sell American Electric Power Company 77.3 73.5 71.7 74.2 95.0 55.5 Hold American Electric Power Company Inc. My analysis resulted in the choice of American Electric Power Company Inc. AEP has been recognized within corporate social responsibility circles as an example of a good corporate citizen. Its fundamentals were impressive in comparison to the rest of the sector and made for a good economic selection. Since August 2014, its stock has performed admirably. A chart of AEP follows. (click to enlarge)