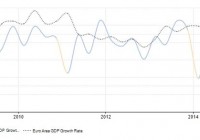
Summary Lockhart will be a new voting FOMC member this year and his first speech of 2015 starts off with a bullish note which justifies rates normalization. Strategic ambiguity of rate hikes in the middle of the year and Lockhart worries about mixed signals in first half of 2015. On mixed reading and to be on the safe side, Lockhart will advocate a later FOMC rate hike and downplays the importance of actual rate hikes. Lockhart concedes that the FOMC Majority view of liftoff date might be earlier than his preference and is willing to be different. GLD short position should be pared down on increased uncertainty over the outlook on FOMC tendency and supported by recent GLD price direction. Changing FOMC Landscape The shortcut in investment is to ask for an answer as if these answers are pre-determined at the back of the textbook. This is the path towards mediocre investment results at best, losing investment results at worst. The investment landscape is fluid and ever changing. The best example would be the Federal Open Market Committee (FOMC) which would be deciding on the first liftoff of Federal Funds Rates and the market consensus would be in the middle of 2015. The FOMC has emphasized again and again that the exact date of liftoff are data dependent. The general market agreement is that the recovery since 2009 to 2014 has been excellent in the United States and the data dependent refers to U.S. economic data for the first half of 2015 given the soft global growth conditions. Another change for the start of 2015 is the changing voting members of the FOMC itself. The regional presidents of Dallas, Minneapolis, Cleveland and Philadelphia will make way for the regional presidents of Chicago, Richmond, Atlanta and San Francisco. Lockhart Bullishness and Support of Rates Normalization In this article, we will focus on the recent speech of Atlanta President Dennis Lockhart given to the Rotary Club of Atlanta on 12 January 2015. As he will have a deciding vote in the FOMC this year, this speech adds on a new significance and his opinions matter more now. His opinions are not easily discernible from his speech and it contains both hawkish and dovish elements in it. Both sides will be presented in this article and I will leave it to readers to decide for themselves before I present my opinion and recommended actions. It has been said that everyone is entitled to their own opinions but not to their own facts. At the beginning of this speech, Lockhart mentioned the strong recovery of the U.S. from 2009 to 2014: As I look back on 2014 and look ahead to 2015, I can comfortably assert that, more and more, the U.S. economy is hitting on all cylinders. The recovery that began in 2009 is well-advanced, and we are getting closer to a point where the Fed’s Federal Open Market Committee (FOMC), the body that formulates monetary policy, can begin a process of normalizing the interest-rate environment. That process will begin with so-called “liftoff”-that is, the first increase in the policy rate. (click to enlarge) Lockhart’s assessment can be backed up from the chart above. The United States GDP growth is indicated by the solid line and the left hand side growth scale while Europe is represented by the dotted line and the right hand side growth scale. The U.S. growth is strong by itself as seen from the -6% recovery in the depth of the crisis to 5% for the third quarter of 2015. The full year growth for 2014 is expected to come in at more than 4%. Europe in contrast dropped by almost -3% and its growth is still below 1% in 2014 after 5 years. Strategic Ambiguity of Actual Rate Hikes While this forms the basis for the normalization of interest rates by the Fed, we are still unsure when the actual liftoff date will be and on the pace of the increase of interest rates. The pace refers to whether the next increase will be the normal 25 basis points or will the FOMC surprise the market with a 50 basis points increase. This is not addressed in Lockhart speech but interested readers can refer to my 2 part articles, here and here . Lockhart speech does give us a time frame for his expected next rate hike which he deploys the use of strategic ambiguity purposely in the quote below: If that is indeed the case, I believe the first action to raise interest rates will in all likelihood be justified by the middle of the year. The phrase “middle of the year” is admittedly not very precise. That’s purposeful on my part. This would represent the mid point of his desired window of the next rate hike from the 16-17 June 2015 to 28-29 July 2015 meetings. However, Lockhart has made it clear that this is not entirely clear as it would depend greatly on the ‘noise’ or mixed reading in the market. He has made it clear that even though he sees that the market has made a strong recovery at the very start of the speech, he is not keen to jump start the liftoff unless he has a clear picture of the recovery in the first half of 2015. This would mean that the economic data for the first 3 months of 2015 will be crucial to Lockhart given the time lag of economic report which can be from 1 to 2 months. Lockhart’s Slightly Dovish Tendencies If the economic reading remains to be mixed or ‘noisy’ as he calls it, then he will be tempted to delay his vote until the third quarter of 2015 or further. Indeed he downplayed the importance of the actual month of the liftoff taking the long term view that over the long term, the actual date of the liftoff wouldn’t matter. If Lockhart started his speech on a bullish note cheering the recovery of the economy ever since 2009, he ended with a slightly dovish note, he noted that there are economic fundamentals that are not yet resolved despite the economy recovery. The economic recovery did not fully address the issues of long term fiscal challenges, the strength and prospects of the workforce, skill, capacity and health of the workforce (which may explain the falling wage pressures despite the drop in unemployment; more people are finding work in low skill and lowly paid jobs), infrastructure quality and innovation funding. While Lockhart acknowledge that these challenges are beyond the reach of monetary policy, monetary policy has a role to play to facilitate the recovery of these economic fundamentals. To me, this is the most dovish aspect of Lockhart’s speech. Of course, these economic fundamentals do not have direct connection with the Fed’s mandates of price stability, maximum employment and financial stability. The primary gauge for price stability is the inflation figures, unemployment rate for maximum employment and the lack of bad news for financial stability. Of course, the Fed can use wage pressures to force up inflation and we will be in for a long period of accommodation but this will put a strain on its financial stability mandate. In its recent December 2014 press conference, the Fed has made it clear that they are willing to wait until 2017 to reach their 2% inflation target. Hence it would appear that even when the Fed is urging patience in its next rate hike, it is also showing patience in achieving its inflation target. FOMC Majority View This is repeated again in Lockhart speech in a slightly different form: The key liftoff decision criteria ought to be closely linked to the FOMC’s two principal policy objectives-maximum employment and low and stable inflation. In my view, the biggest factor influencing the actual timing of a liftoff decision should be the Committee’s confidence that these objectives will be achieved in an acceptable timeframe and, especially, that inflation will move at deliberate speed toward the target of 2 percent per annum. Lockhart is aware that his view on the timing of the liftoff may be different from the majority view of the FOMC. Influential members of the FOMC such as FOMC Vice Chair William Dudley and Fed Vice Chair and FOMC Member Stanley Fischer had indicated last month of their more bullish outlook for the economy. Conclusion and Investment Action My conclusion is that Lockhart is signaling a slightly less bullish tendency to hike rates overall despite his bullish opening statements to his speech. The first quarter of 2015 will be crucial to his decision to raise rates in the June and July 2015 FOMC meetings. We saw a record of 3 dissents in the December 2014 meeting by the regional presidents of Dallas (Fisher) and Philadelphia (Plosser) in the bullish camp and Minneapolis (Kocherlakota) in the dovish camp. All 3 regional presidents will be rotated out of the FOMC this year and will lose their vote. The upcoming FOMC leanings are still unknown and we will know soon on 28 January 2015. Given the uncertainty of the FOMC leanings and this slightly dovish but unclear tendency of this new FOMC voter, one should stay on the sidelines until there is clarity from the FOMC meeting later this month. The SPDR Gold Trust ETF (NYSEARCA: GLD ) is heavily influenced by the FOMC meeting as a gauge of the direction of further inflation trends. GLD is used as a inflation hedge and it will likely appreciate when there is threat of higher inflation. Europe is in the edge of deflation and it remains to be seen that Japan will be successful in fighting deflation. The only major source of inflation would come from the United States and the Fed has indicated its willingness to endure below target inflation until 2017. The case for a bearish GLD comes from the tightening of the Fed rates which will increase investment cost and reduce inflation. Although we know that the FOMC will raise rates sooner or later, it is the timing that will affect the short term price action of GLD. Although my view slightly biased towards earlier, this speech has pushed it slightly to later. Hence the more prudent approach will be to wait and watch the next FOMC by the sidelines for more clarity before deciding our next move. (click to enlarge) We can see the market uncertainty in the price of GLD as seen in the chart above. We have seen nascent strength in GLD in the past 6 trading days. This could represent the market pricing in the possibility of a later rate hike than the June 2015 rate hike with the possibility of third or fourth quarter rate hike. This could also mean that GLD is ranging in uncertainty as it awaits new trading signals. GLD remains the best instrument to trade the price of gold despite critics disillusion with GLD by pointing out on the red flags in its prospectus with regards to audit issues which has been repeatedly mentioned in the comments page in my past articles. GLD has a market capitalization of $28.08 billion and last daily transaction volume of 8.3 million. This is the most liquid equity on the New York Stock Exchange that you can find for trading fluctuations in gold prices. For investors who have accumulated short positions on GLD from my previous opinion pieces, this is the time to pare them down until further clarity can be found at the end of the month.