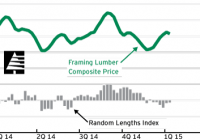
Housing stocks have begun to recover from the bubble and crash of last decade. Some individual homebuilders have attractive fundamentals, but none of the stocks are cheap. Some difficult portents from industry leaders make me wary of the sector for the short term. Longer term, positive factors may come together to make the sectors lead the market once more. Background : With the declining trend in interest rates reasserting itself, this is a good time to discuss a highly rate-sensitive industry, housing. Housing stocks consist of homebuilders (NYSEARCA: ITB ) and also related companies such as lumber stocks, home improvement chains, furniture companies. These are included along with home builders in another large ETF (NYSEARCA: XHB ). ITB and XHB tend to move together; the latter has been stronger since inception and for the past five years. This article reviews several identifiable factors that can be used to make an informed decision about the housing sector, and discusses individual companies within it. Introduction : Since the way houses are built change gradually rather than through breakthroughs such as the GUI and iPhone introduced over the years by Apple (NASDAQ: AAPL ), and because houses are core to human life, they can be great businesses. These stable characteristics have attracted Warren Buffett’s Berkshire Hathaway (NYSE: BRK.A ) (NYSE: BRK.B ) into the business of building and selling homes, manufacturing carpet, and other related businesses. That said, housing is subject to many cycles of different duration, and it used to be said that all housing was local and was not likely to allow the growth of large, geographically-diversified homebuilding companies. Thus, housing stocks go in and out of favor with some regularity. In 1999 and 2000, I used to exclaim to Mrs. DoctoRx that the housing stocks were in such disfavor, trading at such low valuations, that there was no way that the stock market was a valid discounting mechanism – not with Cisco (NASDAQ: CSCO ) at 150X P/E and Yahoo! (NASDAQ: YHOO ) at 100X sales per share at the peak. And so it was that Mr. Market changed his tune, got tired of the techs, and pumped up the housing stocks. I then did very well buying homebuilders in the up-cycle beginning in or around 2002, often for tangible book value – which had started to rise rapidly as the housing bubble inflated. So the stocks did well for us. In the spring of 2005, I was lucky enough to be watching CNBC one morning when an official from the Office of the Comptroller of the Currency came on and warned the public that certain mortgage practices had gotten dangerous. I sold my homebuilder stocks promptly, shortly before they all peaked that summer, and now own just one. My view is that if America is to keep on succeeding, housing must be a big part of that success, so it’s important for a diversified investor to be there when the sector really returns to strength. Let’s look into some of the straws in the wind that could tell us whether now is a good time to find alpha in ITB, XHB or any individual name in or related to those indices. We’ll start by looking to see if lumber products are in uptrends or not. Lumber and panel prices – the trends : An industry weekly, Random Lengths , lets us see yoy trends. This is the latest data: Framing lumber: And structural panels (composites): Not bad. Framing prices are down modestly yoy, but panels are up several per cent. Lumber is also traded on futures exchanges. FINVIZ tracks it: (click to enlarge) This looks less inspiring; there are of course different grades of lumber, and the Random Lengths data is probably more representative. Therefore, my impression is so far, so good. Wood products looked at on a one-year time frame look OK, certainly much better than the average commodity, but since those crashing commodities have a great deal to do with China’s and Europe’s problems, and wood is largely related to domestic demand, it’s hard to be enthusiastic. A longer-term look at lumber prices is more troubling. It looks to me like a classic convex downward topping pattern following the stimulation of the market during 2013’s QE 3 and then a failing set of rallies as the Taper went to its end. Here’s a multi-year look, from the “weekly” setting on the same FINVIZ link: (click to enlarge) Everyone’s eyes will see this differently, but I see it as tracking the recent cycle of stimulus being applied (QE 3 in 2013) and then being withdrawn (the Taper of QE 3 in 2014). So my guess here is toward the negative for what lumber’s chart may be portending. It’s just a guess, though. Let’s look at other data to see how the builders are faring. Homebuilders – recent results : There is actually a fairly consistent pattern here that suggests that demand has been pulled forward a bit, that prices have exceeded the buying power of those who would buy if they could, and that the stocks may therefore be in some trouble. Note I’m going to focus on the builders, as they tend to set the pace for the rest of the XHB. KB Home (NYSE: KBH ), the old Kaufman & Broad, created a contretemps this week. They reported a strong quarter but then on the conference call had some negative comments about the current quarter. The stock simply tanked. It peaked along with lumber prices in the spring of 2013 and now is down close to 50% from that peak. It is down roughly 80% from its mid-2005 peak. Hovnanian Enterprises, Inc. (NYSE: HOV ), which threatened to go bankrupt in last decade’s crash, survived to have a decent October. Nonetheless, its EPS prospects have darkened and it trades at nearly 20X current year EPS estimates given how much they have been cut. With negative book value, HOV could be in trouble. This is what one typically sees after a bubble bursts, and that companies survive on the edge like Hovnanian makes life more difficult for the healthier ones. Toll Brothers (NYSE: TOL ), which is the builder I own a bit of, also reported recently. TOL has a book value of $3.8 B, all of which is tangible book. Because of its exclusive only on higher-end homes and its long history as a market leader in that higher-margined niche, I believe that TOL has substantial intangible value. It ought to be a potential acquisition candidate for Berkshire Hathaway. Nonetheless, despite reporting a “beat” for the October quarter, TOL has seen EPS estimates for its FY ending Oct. 2015 drop about 10%. The stock is off its 12-month high but is much closer than KBH or HOV to its all-time high near $60. I take this as a sign of strength. TOL is selling at about 17X forward 12-month estimates, which are not set in stone. But at about 1.6X book value, it is solidly within a long-term buy-and-hold range, given that apart from the nonsense of 2004-5, it typically trades between 1X and 2X book value. I like TOL for the long haul. Lennar (NYSE: LEN ) reports Thursday (I am writing this Wednesday night). Like TOL, it has a relatively strong chart and could be a differentiated star in the next up-cycle. One other large builder that I like, which has had a little bit of mismanagement in at least one region, but has a stock that has uniquely lifted into all-time high territory is NVR (NYSE: NVR ). That it is in ATH ground is by itself reason to follow this name. NVR’s price:book is distorted by massive shrinkage of its float before the Great Recession. Periodically, NVR sees nice insider buying, and every once in a while, I trade it – but I don’t love its valuation enough to make it a core holding. Other larger builders, such as MDC Holdings (NYSE: MDC ) have declining EPS and declining estimates. So the sector has mixed prospects without any clear uptrend despite the interest rate downtrend the entire last twelve months. This situation does not merit a high, or necessarily any, allocation from smaller investors and usually does not encourage large investors to overweight the sector. Interest rates and general valuation issues : The periods of dropping interest rates which followed the ends of QE 1(mid-2010) and QE 2 (Q3 2011) were not good periods for ITB or XHB. We are here again and something similar looks to be happening; this pattern merits close attention to see if it in fact evolves similarly. This is another reason that I am cautious about the stocks right here. Given how low mortgage rates already are, there is no reason that they should have to drop any further to stimulate boom times for the housing sector. Unfortunately, through no special fault of the builders, the first-time home buyer is too often living in his/her parent’s home or else is renting, unable to scrape together even a 3% down payment for a new home. These are some of the well-known but not easily-solved problems for the homebuilder and related stocks. Both ITB and XHB have no special allure on a valuation basis. They trade at high-teen’s P/E’s and above 1.5X book. Dividend yields are low, EPS trends are difficult for analysts to predict more than a year out, and most companies in each index have modest if any moats. So I’d like cheaper valuations before committing much money to the sector. Toll is a partial exception as it has a decent moat; Lowe’s (NYSE: LOW ), which is a member of XHB, is a category-killer. So is Home Depot (NYSE: HD ), which is too much of a mega-cap to be included in XHB. Again, aside from those giants, which I offer no opinion of in this article, the components of these ETFs should in my view trade at lower valuations before they become really attractive. Concluding thoughts – the importance of burst bubbles : There’s a lot to be said for industries that are important and glamorous enough to be the subject of bubbles. America itself was the subject of a bubble via stocks in 1929, and while the bubble broke very badly, the market had it right: the future was bright indeed for the United States. Certainly, investors had it right about home-based and laptop computing, plus mobile communications, in the 1990s, but of course they overpriced many stocks for a number of years. Then the Great Recession came, and lo and behold, tech did not suffer badly in the market; it then became the market leader since it bottomed before the overall market during the post-Lehman crash period. Assuming there will be another bear market in the next few years (not necessarily anything as severe as the 2008 period), homebuilders might act the way tech did then. There are good reasons to hypothesize this outcome. Interest rates have come down for reasons much of which have little to do with domestic issues and a lot to do with what might be a bursting bubble in China, plus what used to be called Eurosclerosis. Millenials have obvious unfilled demand for housing, and the housing stock in this country is getting a mite aged. So, while there may be a period of further indigestion ahead as the malinvestments of the housing bubble work themselves out, I’m optimistic that at some point, ITB and XHB will be market leaders in a future bull market just as tech has been in the current one. For now, focusing on the homebuilders, the only reasonably valued stock that is differentiated enough to keep as a long term hold in my view is TOL. Should it prove to be doing something really right based on Thursday’s upcoming earnings report, perhaps LEN could join it. Longer term, NVR has been a quite impressive outperformer, and thus might merit attention as an individual stock to own, especially on a general market or sector pullback. Looking at the XHB for non-homebuilder stocks, I do not see any special bargains. An old rule of thumb which was thrown away during the housing bubble was that homebuilders should in fact trade around 1.5X book value, because there was not much of a moat behind their business models. I think that as the bubble recedes into memory, this is a sensible approach to investing in the sector that helps to smooth out the often-violent earnings cycles. To answer the question in the title, my guess is that the housing stocks are, in the short run, more likely to roll over than rock on after a strong several years. That’s not a high conviction opinion, though. But I’m positive on a longer term basis, especially if Mr. Market allows a less expensive purchase price. Neither ITB nor XHB is a fund for the faint of heart. Neither is TOL, which has never paid a dividend and which typically sees substantial insider selling. As usual for non-blue chip companies, market, company and sector risks are non-trivial here. To summarize my views on the sector, there are several positives that combine to make for an attractive set-up even as the debris of the bubble makes the immediate future perhaps bumpy and dangerous for these stocks. These positives include demographic pressure, low interest rates and large areas of land suitable for development. It appears likely that this concatenation of favorable factors will allow ITB and XHB to shine again. Thus I think that investors should keep these funds and high-performing individual names in the sector in their sights, though I am not bullish on these stocks right now.