Tag Archives: alternative

Low-Volatility ETFs Outperform In Shaky Market Conditions

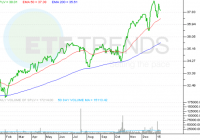
Summary Volatility in the markets is rising. Low-volatility stock ETFs are outperforming. A closer look at two low-vol ETFs. Low-volatility exchange traded funds that have taken a more cautious approach have outperformed the broader equities market as short-term concerns unbalanced stocks’ march upward. Over the past year, the PowerShares S&P 500 Low Volatility Portfolio ETF (NYSEArca: SPLV ) gained 19.2% and iShares MSCI USA Minimum Volatility ETF (NYSEArca: USMV ) rose 18.2%. Year-to-date, SPLV was up 0.1% and USMV was 0.5% higher. In contrast, the S&P 500 index increased 13.5% over the past year and fell 1.7% year-to-date. Market volatility is spiking as concerns mount over the potential effects of a plunge in crude oil prices. The CBOE Volatility Index, or VIX, closed at 21.6 Wednesday, compared to its historical range between 15 and 20. The VIX, a gauge of demand for protection against losses in U.S. equities, has oscillated more than 10% in three trading sessions since December 31. “Every time oil goes down into a new range, those fears reignite,” Paul Zemsky, head of multi-asset strategies at Voya Investment Management LLC, said in a Bloomberg article. “Will something happen in Russia? Will a hedge fund blow up? Which banks will get hammered by this?” However, a rise in volatility has helped the least volatile stocks standout. Moreover, low-volatility equities are experiencing greater demand due to low interest rates. Traditionally, investors would turn to fixed-income assets to diminish risk exposure. However, with rates more likely to rise and the U.S. economy expected to continue expanding, investors have turned to low-volatile stock options to capture a growing equities market and to hedge some of the market risks. For instance, both SPLV and USMV overweight outperforming defensive sector stocks. Specifically, SPLV includes a 20.2% tilt toward health care and 16.0% in consumer staples. USMV has 18.4% utilities and 15.6% consumer staples. Both ETFs also underweight the energy sector, the worst performing area of the market. SPLV takes 100 stocks from the S&P 500 that have exhibited the lowest volatility over the past year and weights holdings by the inverse of their volatility, so the largest components show the least amount of volatility. USMV also tracks low volatility stocks, but the ETF targets variances and correlations for all stocks, along with other risk factors. PowerShares S&P 500 Low Volatility Portfolio (click to enlarge) Max Chen contributed to this article .

What Does History Tell Us About Consolidated Edison’s Valuation?

Shares of Consolidated Edison have previously traded at a valuation comparable to today’s mark. This article looks at what happened then, noting that while the P/E ratios are similar, today’s dividend yield is lower. In the end it comes down to your expectations, but it appears as though shares of ED are exchanging hands at the upper end of their historical range. Shares of Consolidated Edison (NYSE: ED ) increased in price by about 19% during 2014 — moving from $55.28 at the beginning of the year to $66.01 at year-end. If you add in dividends received, equating to $2.52 per share , your total return would have been roughly 24% — a full 10% higher than the S&P 500 index (NYSEARCA: SPY ). Despite the strong underlying business, this wouldn’t be something that you would expect moving forward. Utilities don’t routinely provide market-beating returns, at least not year-in and year-out. During the past 12 months the company reported earnings per share of $4 . With today’s share price around $68, this translates to a P/E ratio nearing 17, a dividend yield of 3.7% and payout ratio of 63%. The valuation approached similar levels during 2012 and 2013, but really you have to go back to 2007 to make a reasonable historical comparison — one or two years of history isn’t as telling as eight might be. At the end of 2006 the company reported adjusted earnings per share around $3 . During March of 2007, shares were changing hands around $51 resulting in a trailing P/E ratio near 17 — much like today. The dividends declared that year equaled $2.32, for a dividend yield of 4.6% and a payout ratio near 80%. Today the dividend yield and payout ratio is lower, but has a similar earnings multiple. So how did things end up for the investor of 2007, partnering with the company at a higher valuation and lower dividend yield than what was recently available? As previously mentioned, the stock price went from $51 to $66 — a 29% total increase or an annual increase of about 3%. Here’s a look at the dividends received: 2007 = $1.74 2008 = $2.34 2009 = $2.36 2010 = $2.38 2011 = $2.40 2012 = $2.42 2013 = $2.46 2014 = $2.52 Note that this particular investor would have missed a dividend payment in 2007 due to the March purchase date. In total you would have collected $18.62 per share in dividends for a total value of roughly $85 or a 6.8% annualized compound return. Earnings per share grew by nearly 4% over this time, while the dividend grew by just over 1% per year. Shares would have traded at roughly the same beginning and end P/E, which means the return was a function of earnings growth and an above average dividend. If the company is able to grow earnings and dividends by a similar amount moving forward, you might expect returns to be in the 6% to 8% range — quite reasonable for a slow growing utility with a steady eddy dividend. However, these assumptions are based on the same historical growth and the same future earnings multiple. Let’s look at different possibilities to get a better feel for where shares to stand today. Although Consolidated Edison has previously traded with a similar valuation as it does today — call it 17 times trailing earnings — it hasn’t traded much higher than this, at least not in the last few decades. So it wouldn’t be especially prudent to suggest that shares might trade at 22 times earnings next year or something of the sort. It’s possible, sure, but that wouldn’t be a particularly cautious expectation. Instead, you might imagine that an earnings multiple closer to 14 or 15 would be more appropriate — as has been the historical norm. Analysts are expecting intermediate-term earnings growth to be in the 2% to 3% range — let’s call it 3%. While the dividend could grow at a faster rate, the company’s recent history isn’t especially impressive in this regard. For illustration, let’s use a dividend growth rate of 2%. If the dividend per share were to grow by 2% annually, this could mean collecting 20% of your original investment in the form of dividends within five years. However, 3% earnings growth and future P/E of 15 would mean that the share price would effectively stagnant. As such, your total return expectation would be entirely dependent on the dividend resulting in roughly 4% returns on an annualized basis. Of course all of this is speculation — Consolidation Edison could grow much faster or even slower in the future. However, using information like this can better prepare you for making financial expectations. In a reasonably rosy “good case” an investor of today could see total annual returns in the 6% to 8% range. These returns are dependent on shares either trading with a higher than normal P/E ratio or else seeing the business perform better than expected. Your base case would be 3% to 5% yearly returns, effectively collecting the dividend payment along the way. This payment would be expected to grow — as it has for the last 40 years — albeit at a relatively slow pace. Finally, a downside case — say 1%-2% earnings growth and a 14 P/E — might indicate yearly returns of just 1%-2%. Whether or not today’s price is “too high” for Consolidation Edison is up to you, but keep in mind that its more difficult to “grow out of overpaying” for a slower growth utility. What does history tell us about Consolidated Edison’s current valuation? By starting with a higher earnings multiple, it’s possible to see reasonable returns in the future but not altogether prudent to expect them.
Why Lower Inflation In India Is A Good Sign For International Investors

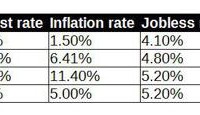
With lower inflation in India than previous years, HSBC forecasts the Indian rupee will remain highly stable this year, reducing exchange rate risk for investors. The Sensex stock market index has vastly outperformed that of Brazil, China and Russia – India’s stock market offers very attractive growth prospects. As an English-speaking country and a centre of technology worldwide, I believe India is at a distinct competitive advantage relative to its peers. Of all the four BRIC economies, I believe that India in particular has the potential to become the most powerful emerging market in the world by 2040. The country has never been over-reliant on manufacturing to sustain economic growth – India’s English speaking workforce along with the country’s status as a major technology give its economy a distinct advantage compared to that of Brazil, China and Russia. In particular, with India now set to meet inflation targets, this could mean very good news for international investors looking to get in on the India growth story. In comparing inflation rates across the BRIC economies, we can see that China has the lowest inflation rate currently at 1.50%, with Russia having the highest inflation rate at 11.40%. India’s inflation rate stands at 5.00%. Inflation is clearly an important consideration for international investors. As an American investor (or a European one, in my case), inflation has a direct impact on exchange rates – higher inflation typically results in a lower exchange rate as consumers stop spending due to higher prices. If this is the case, then a weakening Rupee means that our investment is worth less in dollars or euros. (click to enlarge) (click to enlarge) (click to enlarge) (click to enlarge) (click to enlarge) Sources: Trading Economics In terms of inflation rates, India has been successful in bringing inflation down from a previous rate of 8% in 2012. All else being equal, China would appear to look more favorable as a lower rate of inflation would not have as great an impact on investment value. However, deflation is currently more of a concern in China and this could also lead to exchange rate risks for international investors. Moreover, we can see that of the four emerging stock market indexes, the Indian Sensex Index has vastly outperformed those of China, Brazil and Russia: (click to enlarge) Source: Yahoo Finance Additionally, HSBC projects that the Indian rupee will continue to maintain strength, as lower oil prices will continue to lead to improvements in current account and inflation targets. HSBC reports that the rupee is expected to oscillate between 62.5 and 63 to the dollar this year, which should lead to a high degree of exchange rate stability for international investors. I expect that the long-term outlook for India’s stock market will remain positive due to effective management of inflation and strong fundamentals – stable exchange rates and inflation management means that the Sensex is likely to experience less volatility than that of other emerging markets. In conclusion, India’s use of effective monetary policy in reducing inflation to sustainable levels is clearly working. This is especially significant to international investors who are looking for stable returns yet vibrant growth. Additionally, given that the Sensex has vastly outperformed the stock indexes of the other BRIC economies, I am highly optimistic on India’s growth story going forward. Now that you’ve read this, are you Bullish or Bearish on ? Bullish Bearish Sentiment on ( ) Thanks for sharing your thoughts. Why are you ? Submit & View Results Skip to results » Share this article with a colleague