Scalper1 News
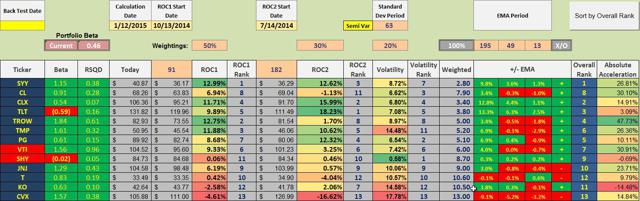 Improve Returns by Staying Out of Trouble. The Importance of Implementing a Circuit Breaker. Is It Working? Back-Testing Issues Explored. Portfolio return and risk are bound together, but there is a way to minimize losses most investors endure in long bear markets of the type experienced in 2008 and early 2009. How does it work? The sample portfolio described below is made up of ten randomly selected dividend aristocrat stocks plus the Vanguard Total Stock Market ETF (NYSEARCA: VTI ), and two treasury ETFs, the iShares 20+ Year Treasury Bond ETF ( TLT) and the iShares 1-3 Year Treasury Bond ETF ( SHY). VTI and TLT are included as references for equity and bond performance levels. SHY is critical as it is the “circuit breaker” ETF. In other words, reduce portfolio draw-down by staying away from securities that under-perform SHY. Investors will populate the ranking spreadsheet with their own holdings. The sample portfolio holds stocks and ETFs for demonstration purposes only. SHY is the exception as it serves as the ranking cutoff ETF. In the sample portfolio below, an investor holding these securities would sell off Johnson & Johnson ( JNJ), AT&T (NYSE: T ), Coca-Cola (NYSE: KO ), and Chevron (NYSE: CVX ) as these four stocks are ranked below SHY based on three metrics (these three metrics are defined in greater detail in prior Seeking Alpha articles ): Performance over the past 91 calendar days. Performance over the past 182 days. Volatility as measured by a semi-variance calculation. The investing model is as follows. Sell securities that are under-performing SHY based on a performance and volatility ranking model. Purchase the top ranked securities. Depending on how much one wishes to concentrate the portfolio the number of securities will vary. I prefer to work with ETFs so I will rank 10 to 15 Exchange Traded Funds and purchase two to five of them so long as they are ranked above SHY. If no securities are ranked above SHY, then hold the cash in a money market or invest in SHY as it is a low volatile security. (click to enlarge) I’m frequently asked, how well does this model perform when back-tested? Any investment model, when back-tested, is prone to all sorts of uncertainty. Here are a few that quickly come to mind. Stocks and ETFs are purchased throughout the trading day whereas back-tests use closing day prices. Price differences over a multi-year study add significant uncertainty into the final performance results. Many investors use limit orders so it may be days before a limit order is struck and there are times when the order is never placed. The start and end dates of a back-test has a major impact on the end performance results. When using ETFs for back-testing, many do not have years of historical data, thus crippling the results. In the above rankings, how many securities are selected for investment? If two work best in the study how can one be sure it will work out best going forward? Many back-tests “over curve-fit” only to deceive the reader. Is the model an anomaly that will disappear as more investors use it? Staying out of trouble has yet to be fully tested as this model has only been operational for less than one year. Nevertheless, the results are positive when working with ETFs that cover broad indexes such as U.S. REITs, Commodities, Gold, International Bonds, U.S. Bonds, U.S. Equities, International REITs, etc. I am tracking the performance of eleven portfolios, each with a different launch date. Each portfolio is reviewed every 33 days and the reviews are scattered throughout the month. Portfolios are analyzed to see if the performance at the end of each week is trending up or down based on the performance six weeks ago. For nearly every portfolio, those trends are positive. While results are reported each week, only trends over many months will answer the question – is this a valid risk reducing model? A “good” bear market will also help to answer the question. Scalper1 News
Scalper1 News