Tag Archives: alternative

The Uranium Bull Is Still Alive, But Paralyzed By The Oil Price Collapse

Summary The uranium sector was negatively impacted by the oil price collapse. The Global X Uranium ETF has recorded a new historical low. The decline is exaggerated and panic driven. Japan announced that it will restart its nuclear reactors, uranium price started to grow and the Global X Uranium ETF (NYSEARCA: URA ) rebounded strongly from its historical lows. It was early November and it seemed that the uranium sector found its bottom and the bright future is finally on the horizon. Then the URA price started to tank again and it has created new historical lows in January 2015 (chart below). But the uranium bull isn’t dead. The bull was just temporarily paralyzed by the collapse of oil prices. (click to enlarge) Source: own processing The most important thing that happened in the energy markets during the last quarter was the collapse of oil prices. The WTI price declined from $90.74 on October 1 to $48.5 on January 16. It represents a 46% decline. It had a negative effect on the whole energy sector, uranium companies including. The chart below shows the development of WTI and URA prices. The URA share price was declining along with the WTI price back in October. The relation changed in early November when the Japanese decision to restart its nuclear reactors spurred a short-lived rally of uranium prices and the whole uranium sector represented by URA as well. But the impact of collapsing oil prices proved out to be too strong. The URA share price started to decline again although the decline started to slow down slightly in December. Source: own processing The URA share price is strongly correlated with the WTI price most of the time. The chart below shows that there were time periods of almost perfect positive correlation during the last quarter. Some short periods of weak negative correlation were recorded only during the first half of November and in the end of December. (click to enlarge) Source: own processing Although URA has created a historical low in the beginning of 2015, the uranium price is still significantly above its summer lows (chart below). The current uranium price of $36.5 per pound is on the December 2013 levels. The URA share price was approximately $14 back then. It means that the current decline of URA is exaggerated and panic driven. Source: futures.tradingcharts.com Conclusion The decline of the Global X Uranium ETF share price seems to be exaggerated and panic driven. The uranium sector was significantly affected by the oil price collapse but the favorable uranium market fundamentals remain. Oil and uranium are not direct substitutes. Oil is mainly used for production of fuels and plastics while the main usage of uranium is to produce electricity. As soon as the markets realize that the bullish uranium fundamentals are still at play, the price of uranium and related securities including the Global X Uranium ETF will start to grow regardless of the oil price development. Now that you’ve read this, are you Bullish or Bearish on ? Bullish Bearish Sentiment on ( ) Thanks for sharing your thoughts. Why are you ? Submit & View Results Skip to results » Share this article with a colleague

MDYV Looks Great In My Analysis – Liquidity Problems From 2012 Are Gone

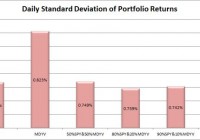
Summary I’m taking a look at MDYV as a candidate for inclusion in my ETF portfolio. The ETF appears to have a fairly low correlation, but poor liquidity in 2012 was interfering with the first pass. Since 2013 began the fund has been significantly more liquid and the correlation remained attractive. I like having a bit of a value tilt in my ETF portfolio construction, so I’m naturally inclined to like the ETF. It doesn’t disappoint and sales through my test. I’m not assessing any tax impacts. Investors should check their own situation for tax exposure. How to read this article : If you’re new to my ETF articles, just keep reading. If you have read this intro to my ETF articles before, skip down to the line of asterisks. This section introduces my methodology. By describing my method initially, investors can rapidly process each ETF analysis to gather the most relevant information in a matter of minutes. My goal is to provide investors with immediate access to the data that I feel is most useful in making an investment decision. Some of the information I provide is readily available elsewhere, and some requires running significant analysis that, to my knowledge, is not available for free anywhere else on the internet. My conclusions are also not available anywhere else. What I believe investors should know My analysis relies heavily on Modern Portfolio Theory. Therefore, I will be focused on the statistical implications of including a fund in a portfolio. Since the potential combinations within a portfolio are practically infinite, I begin by eliminating ETFs that appear to be weak relative to the other options. It would be ideal to be able to run simulations across literally billions of combinations, but it is completely impractical. To find ETFs that are worth further consideration I start with statistical analysis. Rather than put readers to sleep, I’ll present the data in charts that only take seconds to process. I include an ANOVA table for readers that want the deeper statistical analysis, but readers that are not able to read the ANOVA table will still be able to understand my entire analysis. I believe there are two methods for investing. Either you should know more than the other people performing analysis so you can make better decisions, or use extensive diversification and math to outperform most investors. Under CAPM (Capital Asset Pricing Model), it is assumed every investor would hold the same optimal portfolio and combine it with the risk free asset to reach their preferred spot on the risk and return curve. Do you know anyone that is holding the exact same portfolio you are? I don’t know of anyone else with exactly my exposure, though I do believe there are some investors that are holding nothing but SPY. In general, I believe most investors hold a portfolio that has dramatically more risk than required to reach their expected (under economics, disregarding their personal expectations) level of returns. In my opinion, every rational investor should be seeking the optimal combination of risk and reward. For any given level of expected reward, there is no economically justifiable reason to take on more risk than is required. However, risk and return can be difficult to explain. Defining “Risk” I believe the best ways to define risk come from statistics. I want to know the standard deviation of the returns on a portfolio. Those returns could be measured daily, weekly, monthly, or annually. Due to limited sample sizes because some of the ETFs are relatively new, I usually begin by using the daily standard deviation. If the ETF performs well enough to stay on my list, the next levels of analysis will become more complex. Ultimately, we probably shouldn’t be concerned about volatility in our portfolio value if the value always bounced back the following day. However, I believe that the vast majority of the time the movement today tells us nothing about the movement tomorrow. While returns don’t dictate future returns, volatility over the previous couple years is a good indicator of volatility in the future unless there is a fundamental change in the market. Defining “Returns” I see return as the increase over time in the value known as “dividend adjusted close”. This value is provided by Yahoo. I won’t focus much on historical returns because I think they are largely useless. I care about the volatility of the returns, but not the actual returns. Predicting returns for a future period by looking at the previous period is akin to placing a poker bet based on the cards you held in the previous round. Defining “Risk Adjusted Returns” Based on my definitions of risk and return, my goal is to maximize returns relative to the amount of risk I experienced. It is easiest to explain with an example: Assume the risk free rate is 2%. Assume SPY is the default portfolio. Then the risk level on SPY is equal to one “unit” of risk. If SPY returns 6%, then the return was 4% for one unit of risk. If a portfolio has 50% of the risk level on SPY and returns 4%, then the portfolios generated 2% in returns for half of one unit of risk. Those two portfolios would be equal in providing risk adjusted returns. Most investors are fueled by greed and focused very heavily on generating returns without sufficient respect for the level of risk. I don’t want to compete directly in that game, so I focus on reducing the risk. If I can eliminate a substantial portion of the risk, then my returns on a risk adjusted basis should be substantially better. Belief about yields I believe a portfolio with a stronger yield is superior to one with a weaker yield if the expected total return and risk is the same. I like strong yields on portfolios because it protects investors from human error. One of the greatest risks to an otherwise intelligent investor is being caught up in the mood of the market and selling low or buying high. When an investor has to manually manage their portfolio, they are putting themselves in the dangerous situation of responding to sensationalistic stories. I believe this is especially true for retiring investors that need money to live on. By having a strong yield on the portfolio it is possible for investors to live off the income as needed without selling any security. This makes it much easier to stick to an intelligently designed plan rather than allowing emotions to dictate poor choices. In the recent crash, investors that sold at the bottom suffered dramatic losses and missed out on substantial gains. Investors that were simply taking the yield on their portfolio were just fine. Investors with automatic rebalancing and an intelligent asset allocation plan were in place to make some attractive gains. Personal situation I have a few retirement accounts already, but I decided to open a new solo 401K so I could put more of my earnings into tax advantaged accounts. After some research, I selected Charles Schwab as my brokerage on the recommendation of another analyst. Under the Schwab plan “ETF OneSource” I am able to trade qualifying ETFs with no commissions. I want to rebalance my portfolio frequently, so I have a strong preference for ETFs that qualify for this plan. Schwab is not providing me with any compensation in any manner for my articles. I have absolutely no other relationship with the brokerage firm. Because this is a new retirement account, I will probably begin with a balance between $9,000 and $11,000. I intend to invest very heavily in ETFs. My other accounts are with different brokerages and invested in different funds. Views on expense ratios Some analysts are heavily opposed to focusing on expense ratios. I don’t think investors should make decisions simply on the expense ratio, but the economic research I have covered supports the premise that overall higher expense ratios within a given category do not result in higher returns and may correlate to lower returns. The required level of statistical proof is fairly significant to determine if the higher ratios are actually causing lower returns. I believe the underlying assets, and thus Net Asset Value, should drive the price of the ETF. However, attempting to predict the price movements of every stock within an ETF would be a very difficult and time consuming job. By the time we want to compare several ETFs, one full time analyst would be unable to adequately cover every company. On the other hand, the expense ratio is the only thing I believe investors can truly be certain of prior to buying the ETF. Taxes I am not a CPA or CFP. I will not be assessing tax impacts. Investors needing help with tax considerations should consult a qualified professional that can assist them with their individual situation. The rest of this article By disclosing my views and process at the top of the article, I will be able to rapidly present data, analysis, and my opinion without having to explain the rationale behind how I reached each decision. The rest of the report begins below: ******** (NYSEARCA: MDYV ): SPDR S&P 400 Mid Cap Value ETF Tracking Index: S&P MidCap 400 Value Index Allocation of Assets: At least 80% in the index Morningstar Category: Mid-Cap Value Time period starts: April 2012 Time period ends: December 2014 Portfolio Std. Deviation Chart: (click to enlarge) (click to enlarge) Correlation: 81.69% Returns over the sample period: (click to enlarge) Liquidity (Average shares/day over last 10): About 10,000 Days with no change in dividend adjusted close: 34 Days with no change in dividend adjusted close for SPY: 5 Yield: 4.06% Distribution Yield and 1.57% SEC 30 day Yield Expense Ratio: .25% Discount or Premium to NAV: 0.08% premium Holdings: (click to enlarge) Further Consideration: Easily Conclusion: MDYV may be stronger than it looks in this analysis. Since I wanted a value orientation to my portfolio, I already have a bias in favor of the investing style of the fund. Don’t get too wrapped up in the correlation. While it is important under modern portfolio theory, the dividend adjusted close values indicated a problem with liquidity. I checked on that and there were 29 days in which 0 shares traded hands. Normally, that would make skeptical of the average volume, but that would be the wrong choice. Since I looked at MDYG and saw some fairly good numbers, I dug deeper on the liquidity issues. I checked when the days with a volume of 0 occurred. Out of 29 days, 27 of them had occurred in 2012. Over 2013 and 2014 it only happened twice. Therefore, I believe there were liquidity problems initially but those seem to be gone now. Poor liquidity has a tendency to decrease correlation. I reran my statistics based on the dividend adjusted closes since the start of 2013. The sample size is smaller, but still large enough to make statistical inferences and there are only 2 days with 0 volume which means the pool’s data on correlation should be higher quality. Over the shorter time period the correlation was 86.83%. In my opinion, that level of correlation based on better liquidity is still high enough to warrant consideration. Of course, the holdings being so thoroughly diversified, only 3 assets that were over 1%, doesn’t hurt either.
After Rebalancing, CEFL February Dividend Will Bring Yield To 18.8%

The Rebalancing will result in a smaller, but still large yield. However, the discount to book value will make CEFL more compelling. Leveraged income and carry plays such as MORL and CEFL have underperformed what might have expected given the 10-year treasury bond at 1.80% and Federal Funds still at 0.25%. This underperformance is because, among other reasons, those who said the spike in interest rates was imminent three years ago are even more vocal and convinced it is imminent now. The UBS ETRACS Monthly Pay 2x Leveraged Closed-End Fund ETN (NYSEARCA: CEFL ) underwent a rebalancing at the end of 2014. The first monthly dividend based on the new composition of the index upon which CEFL is based, will be paid in February 2015. The dividend will be based on those components that had ex-dividend dates in January 2015. Of the 30 index components, 29 now pay monthly. Only MORGAN STANLEY EMERGING MARKETS DOMESTIC DEBT FUND INC (NYSE: EDD ) now pays quarterly dividends in January, April, October and July. Thus, it will not be included in the February 2015 CEFL monthly dividend calculation. Additionally, some of the monthly paying components do not have ex-dates in January 2015. These are PRUDENTIAL GL SH DUR HI YLD (NYSE: GHY ), ING Global Equity Dividend & Premium Opportunity Fund (NYSE: IGD ) and PRUDENTIAL SHORT DURATION HIGH YIELD (NYSE: ISD ) . Thus, they also are not included in the February 2015 CEFL monthly dividend calculation even though they have pay dates in February 2015. Those components that have not declared dividends but pay regular monthly dividends are included using the most recent dividend they declared. My calculation using the 26 components expected to have ex-dividend dates in January 2015 is for a February 2015 dividend of $0.2721. This would be the smallest monthly dividend since the February 2014 of $0.2461. In February 2014 there were more quarterly payers in the index than now. The rebalancing is the major reason for the smaller monthly dividends. PIMCO High Income Fund (NYSE: PHK ), one of the highest yielding components has been removed. Some people may be quite happy with this since PHK had such a high premium to book value. The rebalancing is done by a formula and thus any investor complaints about PHK played no part in its’ removal. It could even be considered a case of “be careful what you wish for”. Removal of PHK did significantly improve the discount to book value for CEFL as a whole, but also reduced the dividend. I generally do not do much in-depth analysis of the components in the leveraged ETNs I follow. I take much more of a “top-down” approach rather than a “bottoms-up” approach. Not that there is anything wrong with than a “bottoms-up” approach. It is a matter of how I began to first look at mREITs, then ETRACS Monthly Pay 2x Leveraged Mortgage REIT ETN (NYSEARCA: MORL ) and then CEFL as a high yielding diversifier for MORL that also met my top-down Macro outlook. A few years ago I became convinced that short-term rates were likely to remain low for an extended period (see my article: Federal Reserve Actually Propping Up Interest Rates: What This Means For mREITs ), and I concluded that agency inverse floaters would be the ideal investment vehicle to take advantage of that scenario. I was told by dealers in agency securities that there were very few agency inverse floaters around anymore and that you would not want the ones that were. I wanted an investment with negligible credit risk and no margin call risk that would profit from an extended environment of very low short-term interest rates. As agency inverse-floaters and swaps paying-floating and receiving-fixed were not available to me as a retail investor, I concluded that mREITs and MORL were the next best thing to profit from a continuation of the carry generated by very low short-term rates. This was explained in: Are mREITS The New Inverse Floaters? A few years ago there were many who were very bearish on mREITs based on their view that the period of low interest rates would soon be ending. If I had asked even the most bearish person on mREITs three years ago what would happen if in 2015 the rate of the 10-year treasury bond were to be 1.80% and Federal Funds were still to be 0.25%, they certainly would have said something to the effect that: “well then of course you will make a fortune in mREITs and similar leveraged income and carry plays, but that rate scenario is impossible”. We are now have the 10-year treasury bond at 1.80% and Federal Funds are still at 0.25%. A large part of the underperformance of leveraged income and carry plays such as MORL and CEFL relative to what one might have expected given the accuracy of my interest rate outlook, is due to a number of factors. Most significant is that mREITs and closed-end funds have gone from premiums over book value to large discounts. This is because, among other reasons, those who said the spike in interest rates was imminent three years ago are even more vocal and convinced it is imminent now. My previous procedure was to take my monthly prediction of the next dividend to be paid by a leveraged ETN such as CEFL and then add the two prior months to get a projected quarterly figure. This would smooth out any “small month” – “big month” effects due to some components paying monthly and some quarterly. Then I would annualize that figure on a compounded basis. That procedure may not now be appropriate for CEFL at this point in time. The composition of the index has changed significantly. Also, adding up the February 2015, the January 2015 and the December 2015 months would a bias the yield upward since it would include the year-end special dividends paid by some of the closed-end funds. Thus, to get a better measure of the annualized compounded yield I took all of the components and determined a average monthly dividend for each including the quarterly payer EDD and those that pay monthly but did not have ex-dates in January 2015. This results in a monthly average dividend rate of $0.3147. This actually may be too conservative since it assumes there will be no special additional dividends during the entire year. Using the average monthly dividend method this results in an annual payout of $3.78 for a simple yield of 17.3% and a compounded annualized yield of 18.8% with CEFL as $21.80. Using the prior method of adding the projected $0.2721 February dividend to the two prior months would result in an annual payout of $4.69 for a simple yield of 21.5% and a compounded annualized yield of 23.8% with CEFL as $21.80. That also would be biased upwards by the year-end special dividends paid by some of the closed-end funds. See: CEFL January Dividend Gives Yield Of 23% for a listing of the CEFL components that paid special year-end dividends and a description of how the contribution to the monthly dividend from each component is calculated. If someone thought that over the next five years interest rates and economic conditions would remain relatively stable and thus CEFL would continue to yield 18.8% on a compounded basis, the return on a strategy of reinvesting all dividends would be enormous. An investment of $100,000 would be worth $236,305 in five years. More interestingly, for those investing for future income, the income from the initial $100,000 would increase from the $18,800 initial annual rate to $44,425 annually. The table below shows the price as of January 16, 2015, ex-date, pay date, dividend, imputed value and the imputed number of shares for all of the 30 CEFL components. CEFL components as of January 16, 2015     Weight Price ex-div pay date dividend frequency value $mil imputed shares dividends Alpine Global Premier Properties Fund AWP 4.51 6.76 1/21/2015 1/30/2015 0.05 Top of Form m Bottom of Form 16682549 2467833 123392 MFS Charter Income Trust MCR 4.44 8.67 1/13/2015 1/30/2015 0.05 m -.002 16423618 1894304 85244 GAMCO Global Gold Natural Resources & Income Trust GGN 4.39 7.43 3/13/2015 3/24/2015 0.07 m -.02 from2014 16238667 2185554 152989 Clough Global Opportunities Fund GLO 4.38 12.21 4/15/2015 4/30/2015 0.1 m +.005 from2014 16201677 1326919 132692 FIRST TRUST INTERMEDIATE DUR FPF 4.34 22.08 12/29/2014 1/15/2015 0.16 m ex in dec 16053716 727070 118149 MORGAN STANLEY EMERGING MARK EDD 4.32 10.57 12/17/2014 1/15/2015 0.25 q 15979736 1511801 377950 DOUBLELINE INCOME SOLUTIONS DSL 4.28 19.51 1/14/2015 1/30/2015 0.15 m 15831776 811470 121720 BLACKROCK CORPORATE HIGH YIE HYT 4.24 11.3 12/29/2014 1/9/2015 0.08 m 15683815 1387948 104790 Eaton Vance Limited Duration Income Fund EVV 4.23 14.01 1/8/2015 1/20/2015 0.1 m 15646825 1116833 113582 PRUDENTIAL GL SH DUR HI YLD GHY 4.17 16.26 2/19/2015 2/27/2015 0.13 m no ex in jan 15424884 948640 118580 PIMCO Dynamic Credit Income Fund PCI 4.09 20.35 1/8/2015 2/2/2015 0.16 m big ext paid jan 15128963 743438 116199 Western Asset Emerging Markets Debt Fund ESD 4.08 15.86 2/18/2015 2/27/2015 0.12 m 15091973 951575 109431 Eaton Vance Tax-Managed Global Diversified Equity Income Fund EXG 4.04 9.33 1/21/2015 1/30/2015 0.08 m 14944013 1601716 130220 Alpine Total Dynamic Dividend AOD 4.04 8.58 1/21/2015 1/30/2015 0.06 m 14944013 1741726 98408 ING Global Equity Dividend & Premium Opportunity Fund IGD 4.04 8.18 2/2/2015 2/17/2015 0.08 m no ex in jan 14944013 1826896 138844 Eaton Vance Tax-Managed Diversified Equity Income Fund ETY 3.75 11.13 1/21/2015 1/31/2015 0.08 m 13871299 1246298 105063 BlackRock International Growth and Income Trust BGY 3.58 6.75 1/13/2015 1/30/2015 0.05 m 13242467 1961847 96130 ABERDEEN ASIA-PAC INCOME FD FAX 3.49 5.68 1/21/2015 1/30/2015 0.04 m 12909555 2272809 79548 PRUDENTIAL SHORT DURATION HI ISD 3.32 16.37 2/19/2015 2/27/2015 0.12 m no ex in jan 12280723 750197 91899 Calamos Global Dynamic Income Fund CHW 3.2 8.64 12/29/2014 1/6/2015 0.07 m not decl 11836842 1370005 95900 MFS Multimarket Income Trust MMT 2.91 6.31 1/13/2015 1/30/2015 0.03 m 10764128 1705884 54588 BLACKSTONE/GSO STRATEGIC C BGB 2.69 16.15 2/18/2015 2/27/2015 0.11 m 9950345 616120 64693 Allianzgi Convertible & Income Fund NCV 2.52 8.84 1/8/2015 2/2/2015 0.09 m 9321513 1054470 94902 WESTERN ASSET HIGH INC FD II HIX 2.25 8.1 2/18/2015 2/27/2015 0.07 m 8322779 1027504 70898 Blackrock Multi-Sector Income BIT 1.92 17.19 12/29/2014 1/9/2015 0.12 m not decl 7102105 413153 48215 WELLS FARGO ADVANTAGE MULTI-SECTOR ERC 1.75 13.63 1/12/2015 2/2/2015 0.1 m 6473273 474928 45926 Allianzgi Convertible & Income Fund II NCZ 1.63 8.24 1/8/2015 2/2/2015 0.09 m 6029391 731722 62196 Wells Fargo Advantage Income Opportunities Fund EAD 1.35 8.8 1/12/2015 2/2/2015 0.07 m 4993668 567462 38587 Nuveen Preferred Income Opportunities Fund JPC 1.14 9.52 1/13/2015 2/2/2015 0.06 m 4216875 442949 28039 Invesco Dynamic Credit Opportunities Fund VTA 0.91 11.62 1/12/2015 1/30/2015 0.08 m 3366102 289682 21726