Tag Archives: alternative

Tiger Woods And Investment Gurus Lose Their ‘Touch’, Question: Do They Ever Get It Back?
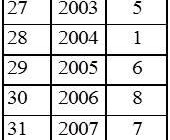
Summary What do golf and investing have in common? The great performers have their ups and downs. These ups and downs of golfer Woods are compared with those of two investment gurus. Elliott R. Morss ©All Rights Reserved February 2015 Introduction Watching Tiger Woods get an 82, the worst score of his career at the Waste Management Phoenix Open on January 30th, I was reminded of other “greats” who have lost their touch. In particular, I thought of some of the great investors, like Graham, Lynch, Zweig, Greenblatt, O’Shaughnessy, and Buffet. 1 The investment performance of these gurus was truly remarkable, but like Tiger, they also have had their ups and downs. In what follows, I look at their records, Tiger’s records, along with what John Reese of Validea has been able to do using a computer model simulation of certain investment gurus’ strategies to pick stocks. Tiger Woods Woods has won 83 professional tournaments. He holds the record for most consecutive weeks at No. 1 (281), and the most total number of weeks (683). Since 1997, he has spent over twelve years atop the Official World Golf Ranking, and has been the number one player for all 52 weeks a record eight times. Few would argue that in his prime, Tiger was the most dominating and best player that ever lived. But since 2009, due to a series of physical ailments and personal problems, he has won only 10 tournaments and none of the Majors. Table 1 gives Tiger’s professional tournament wins by years. Table 1. – Tiger’s Wins Tiger is now 39 years old. Jack Nicklaus has won 3 more majors with his last win at 46. The usual question is whether Woods will be able to catch up to Nicklaus. It is striking how Tiger’s performance has fallen off… Peter Lynch I am a true believer in the random walk theory of stock prices , i.e., most information about individual stocks is reflected in their prices almost immediately. That suggests that unless you have information others do not have, picking stocks is a pretty random business. And this makes what Peter Lynch did at the helm of Fidelity’s Magellan Fund (MUTF: FMAGX ) even more impressive. As Table 2 indicates, Lynch did much better than the S&P 500 (^GSPC) in all but 2 years. Table 2. – Magellan Fund Performance The “Spread” (difference between (^GSPC) and the S&P 500 is indeed impressive. It means that on average if the S&P 500 gained 5%, Magellan gained 22.5%! And note that even in the two years the S&P 500 outperformed Lynch, the spread was very small. John Reese – The “5 Gurus” Reese has a degree in computer science from the Massachusetts Institute of Technology. He became intrigued with investment gurus and developed a computer program to simulate the stock picks of selected gurus. And since 2003, he has recorded the picks of the ” Top Five Gurus ” in a 10-stock portfolio that contains the top 2 ranked stocks from each of these guru investors. The top 5 gurus are selected based on their historical risk-adjusted performance. While the 5 guru’s performance (Table 3) is not as impressive as Lynch’s, it is nevertheless quite amazing. It means that on average if the S&P gained 5%, the 5 Guru Portfolio gained 17.9%! Table 3. – Performance of Reese’s “Top Five Gurus” Comparing Woods with the Investors Is there any reason to expect a comparison of Woods playing golf and gurus picking stocks as meaningful? I think so. Both activities are intensely mental. And in both activities, there is a danger of overthinking and becoming more “technical”. Because the length and time of the three differ, Table 4 breaks them down by period quartiles (earliest years to most recent years). And one commonality is quite apparent – the performance of all declined from their earliest years. And while it is true that getting older leads to reductions in physical performance, Woods is not old enough to justify such a decline. Table 4. – Comparing Investors with Golfer Woods On overthinking and getting more technical, Reese’s system should not be affected since his stocks are picked by a computer model. And in comparison to Lynch, the decline in Reese’s 5 Guru Model is not as significant as Lynch’s. The Future Of course, the Lynch career is over. But how about Woods and Reese? Woods is showing all the signs of overthinking and trying to get his “touch” back in technical fixes. Reese? Hard to say. So far in 2015, his “5 Guru” portfolio is down 2.7%, while the S&P is down 2.0%. Reese has just launched an ETF – the Validea Market Legends ETF (NASDAQ: VALX ). It gives investors an opportunity to invest in accordance to Reese’s modeling of gurus. While the “5 Guru” model takes the leading 2 stocks from the leading gurus, VALX takes 10 of these guru strategies and combines them together in a 100-stock portfolio. So far this year, VALX is down 2.2%. Because of Reese’s past performance, VALX and the “5 Gurus” bear watching… 1 For more on these investment gurus, see John Reese and Jack Forehand’s book, The Guru Investor: How to Beat the Market Using History’s Best Investment Strategies . Disclosure: The author has no positions in any stocks mentioned, and no plans to initiate any positions within the next 72 hours. (More…) The author wrote this article themselves, and it expresses their own opinions. The author is not receiving compensation for it. The author has no business relationship with any company whose stock is mentioned in this article.
ALLETE, Inc: Consistent Dividends Since 1950

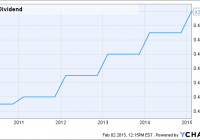
The company has paid dividends consecutively since 1950. The shares currently sport a yield of about 3.57%. Growth of the company points directly to further growth of the dividend. As I continue my never-ending quest to find quality companies with safe, and attractive dividends, my search led me to ALLETE, Inc (NYSE: ALE ). The diversified utility company mainly focuses on electric generation in Minnesota, North Dakota, and Wisconsin. Founded in 1906, the company has a rich history, but I am more interested in its dividend history. In late January it raised its dividend 3.1% to 50.5 cents a quarter. With the raise the company now sports a 3.57% yield that is very attractive in my eyes. This was the fourth straight year of a raise, according to Dividends.com. This doesn’t seem like that much, but what I view as being just as important is consistency. Even so I believe going forward the company will continue this track of dividend growth and that is one of the main reasons I’m a fan. ALE Dividend data by YCharts The company has paid a consecutive dividend since 1950, and this is most definitely not going to change anytime soon. Some don’t like to reference the past to point to the future, however, I always believe a strong dividend history is a plus. It shows the company is dedicated to maintaining its dividend even when the market may be bad overall. On a different note, growth is setting up nicely for the company and the chart below illustrates this beautifully. year Revenue Earnings Per Share 2013 $1.02B $2.63 2014(Est) $1.09B $2.93 2015(Est) $1.15B $3.21 (Source: Yahoo Finance ) The company is expected to release its Q4 2014 results along with its FY 2014 results on February 17th before market open. Revenue, as seen above, is estimated to be reported up 7.4% compared with last year. EPS is expected to be up 11.4% compared with last year, and that trend looks to continue with EPS forecasted to be up another 9.55% for FY 2015. I have heard a lot lately about utilities being overpriced, and for some names I am in agreement. Currently the shares are trading at 19.33 times earnings, which is lower than the industry average at 21.8. The forward price to earnings is 17.9, and this is why I believe the shares are not currently overpriced. The company currently has a payout ratio of about 65%, which is a very safe number for a business in a quite stable and consistent industry. EPS of $3.21 for 2015 point to a payout ratio of just 62.8%. This then points to the company being in a great position to raise the dividend again in the next year. Beyond that, things also look good for more raises with earnings increasing nicely into 2016. A mid-term growth catalyst for the company is its recent acquisition of U.S. Water Services. This further diversifies its holdings and will provide an extra boost to growth. U.S. Water generated $120 million in revenue in 2014 and the company projects it to grow revenue 10%-15% on an annual basis going forward. This is a great investment for the company and should definitely begin to pay off during the next few years. I love this diversification because as a diversified utility, it offers good exposure for one’s portfolio. In conclusion, ALLETE is yet another strong dividend payer in the utilities sector. Although the company’s core business is electricity generation, it does have a fairly diversified portfolio of holdings, adding to it most recently with the purchase of U.S. Water. The growth trend looks to be strong, and the company has lots of room to continue to raise its dividend in the future. I believe as a long-term play, ALLETE will continue to reward its shareholders both through growth in the business and the dividend. Disclosure: The author has no positions in any stocks mentioned, and no plans to initiate any positions within the next 72 hours. (More…) The author wrote this article themselves, and it expresses their own opinions. The author is not receiving compensation for it (other than from Seeking Alpha). The author has no business relationship with any company whose stock is mentioned in this article. Additional disclosure: Always do your own research before investing.

Brookfield Infrastructure Offers Investors A 5% Dividend Yield And 13% Discount To Intrinsic Value

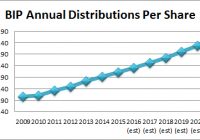
Summary BIP recently increased its dividend by 10% and now sports a 5% dividend yield. We believe BIP’s long-term dividend growth rate is 9%, up from 7% in our previous report. BIP’s shares are still 13% below its fair intrinsic value and we expect its intrinsic value to steadily increase as BIP steadily grows its FFOs per share. BIP’s disciplined approach to investing and its ability to continually identify new investment opportunities. We expect 15% FFO/share growth in 2015 and at least 6.5% growth thereafter. Brookfield Infrastructure Partners (NYSE: BIP ) recently announced it increased its dividend distribution by 10%. Although it was lower than our previous single year dividend growth in 2015, it was higher than our previous 7% estimated long-term dividend growth rate. BIP’s dividend increased by 13% annually since its 2008 IPO and BIP expects its long-run dividend growth rate will be 5%-9%. We believe that future dividend growth will be closer to the higher end of its forecasted range as it offers strong, steadily growing cash flow funds from its operations, which enables BIP to provide investors with strong dividend yields and dividend growth. BIP offers investors a 5% dividend yield and we believe its share price is 13% undervalued relative to its fair intrinsic value. For these reasons, we reiterate investors accumulate shares in BIP, especially income-oriented investors as BIP continues its consistent performance . Source: BIP’s Investor Relations and Our Estimates Companywide Highlights: BIP’s Q4 2014 FFOs/unit was $.86, slightly missing analyst expectations for the fourth time in the last 5 quarters but increasing by 3.6% versus Q4 2013. Key drivers of this performance were as follows Incremental contributions from the mid-August close of its investment in Vale’s cargo transportation division VLI, Improved volumes at its UK ports and Australian railroads, Soft volume demand from its North American energy transmission businesses due to mild weather and The absence of incremental contributions from its former Australasian regulated distribution operations, which BIP sold last November. Source: BIP’s Q4 2014 Report Business Segment Highlights: BIP Transport saw a 20% increase in its FFO’s for 2014 versus 2013 primarily driven by contributions from the additional investment in BIP’s Brazilian toll road in Q3 2013 as well as increased volume from its ports division and a partial quarter’s contribution from its investment in Vale’s cargo transportation VLI. Not only is this a high-quality asset, but Vale provided BIP with a minimum return mechanism to ensure that a minimum return is achieved over a period of up to six years from closing. As the Brazilian economy is facing some negative headwinds , this minimizes the risk of BIP failing to generate a positive return from its investment in VLI. Highlights from BIP Transport’s business units were as follows: BIP Transport’s Ports business enjoyed 21.4% FFO growth due to improved volumes from its UK port operations and incremental contribution from its newly acquired North American container port acquired during the year. BIP Transport’s Railroad business’s FFOs increased by $14M year-over-year (7.5%) because of a partial year’s incremental contribution from its Q3 2014 investment in Vale’s cargo transportation division as well as increased harvest grain volumes from its Australian railroad operations. BIP Transport’s Toll Road business saw its FFOs increase because of additional investment in its Brazilian toll roads completed in Q3 2013. On a “same-store basis”, toll revenues increased by 8% year-over-year due to tariff increases and higher volumes on Chilean roads. Source: BIP’s 2009-14 Annual Reports BIP Utilities saw a 2.65% decrease in its 2014 FFOs versus 2013 on a reported basis but increased 12% on an adjusted comparable continuing operations basis. The decrease in reported FFOs was primarily attributable to the sale of its Australasian regulated distribution operations on November 30, 2013. Excluding the impact of the sale, the segment’s FFOs increased by $39M versus the prior year as of the result of improved performance at BIP’s UK regulated distribution business. Source: BIP’s Financial Reports, Supplemental Reports BIP Utilities’ maintenance capital expenditures in 2014 were $14M and were $27M less than YTD 2013. BIP Utilities’ Regulated Terminal grew by 2.2% as negative movements in foreign exchange offset incremental pro forma operating income growth due to additions to its rate base. BIP Utilities’ Electricity Transmission business increased its FFOs by 7.4% due to inflation indexation, commissioning of projects into rate base and lower operating costs, partially offset by impact of foreign exchange. BIP Utilities’ Regulated Distribution’s adjusted FFOs from continuing operations grew by 22.5% as its United Kingdom regulated distribution operations benefited from a higher rate base, inflation indexation, lower costs and higher customer connections revenue. Source: BIP’s 2009-14 Annual Reports BIP Energy’s FFOs decreased by $2M year-over-year as incremental contribution from the acquisitions district energy businesses during the last 12 months was not enough to offset lower transportation volumes at its Energy Transmission, Distribution & Storage Business. BIP North American gas transmission business continues to see headwinds from the weak natural gas market, which resulted in a $275M asset impairment charge in 2013. Although BIP Energy’s performance has been flat since 2011, at least its capital expenditure backlog more than doubled during the year, which signals potential future growth. Other sources of potential future growth for BIP Energy include the closing of three previously announced acquisitions including gas storage businesses in California and Texas and a district energy system in Seattle. BIP also acquired a district energy business in Australia recently and is closing the acquisition of another one as well. Source: BIP’s 2011-14 Annual Reports BIP’s Corporate and Administrative segment’s FFO decreased by $12M (13%) in the year as increased interest and distribution income and reduced financing costs were offset by the absence of BIP Timber’s results as BIP sold BIP Timber in H1 2013 and higher management fees paid to Brookfield Asset Management. Corporate highlights include the following: BIP’s previously announced acquisition of a 23% interest in the French communications tower infrastructure firm TDF is expected to close in March 2015. BIP Corporate refinanced $4B of its debt in 2014 in order to capitalize on the historically low interest rate environment. BIP’s weighted average cost of debt is 5.9% and the average maturity profile is over 10 years, with minimal maturities over the next 5 years. BIP identified $1B in non-core assets that it seeks to sell in order to redeploy towards areas of growth and core operations, on top of its $1B capital-recycling program in 2013. BIP finished the year with $2.1B worth of total liquidity through its cash and available credit facilities. BIP has a BBB+ credit rating and it expects strong demand for its future offering $300M-$500M corporate debentures, which it seeks to bring to market in H1 2015. BIP’s opportunities for investment Government Privatizations-In Australian alone, BIP identified $50B worth of potential privatizations by the federal and state governments there Brazilian Construction Companies-BIP recognizes that many Brazilian construction companies are facing financial challenges and may seek to part with high-quality infrastructure related assets in order to shore up liquidity. Corporate deleveraging and carve-outs-BIP had success in acquiring utility assets from capital constrained European companies and is now Maturing Infrastructure Funds- Many investment funds raised between 2005 and 2008 are approaching the expiry of their funds. BIP has started to see the first wave of divestitures from this ownership group. Lastly, BIP focuses on investing capital to meet its long-term return targets of 12%-15% and will not reduce its return thresholds to make it easier to acquire assets Conclusion: In conclusion, investors looking for high yields and non-equity correlation should consider accumulating a position in BIP due to its portfolio of unique, hard-to-replicate assets. BIP provided unit-holders with strong returns from capital appreciation and partnership unit distributions since it went public in 2008. BIP offers a 5% dividend yield and its unit price is within 13% of its fair intrinsic value. We expect BIP’s FFOs to increase by at least 6.5% annually over the next seven years and its dividend distributions to increase by at least 9%. We can see why over 50% of BIP’s shares are held by leading asset managers such as Brookfield Asset Management, Legg Mason, BAMCO, Principal Global Investors and Scotia Bank’s asset management divisions. For these reasons, we believe investors should realize that BIP is a great alternative to the S&P 500 and traditional utilities as represented by the XLU and take advantage of market weaknesses to strategically accumulate units of BIP. Source: FactSet Marquee and our Estimates Disclosure: The author has no positions in any stocks mentioned, and no plans to initiate any positions within the next 72 hours. (More…) The author wrote this article themselves, and it expresses their own opinions. The author is not receiving compensation for it (other than from Seeking Alpha). The author has no business relationship with any company whose stock is mentioned in this article.