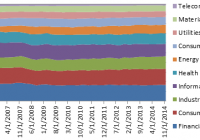
Summary The simplest of smart beta methodologies is widely accepted to be equal weighting. But traditional equal weighting also introduces static sector biases since the weight allocated to each sector is determined solely by the number of companies in the sector. We believe employing sector equal weighting followed by constituent equal weighting in the rebalancing process may ultimately be a better way to distribute risk across the portfolio. By John Feyerer The core belief that we have held at PowerShares since we were founded back in 2002, and continue to hold today, is that funds tracking market-capitalization-weighted indexes may not represent the optimal investment strategy. Why? If one believes (as we do) that markets aren’t perfectly efficient and security mispricing can and does exist, market-capitalization-weighted indices will, by definition, have overweighted those securities that through time proved to be overvalued and similarly will have underweighted those securities that proved to be undervalued – thus creating a relative drag on investment performance. Of course the quest for active managers is to accurately identify which camp each security falls into at a given point in time (overvalued versus undervalued) and position portfolios to capitalize on the reversion to the mean. In contrast, smart beta strategies are objective, rules-based, index methodologies that sever the link between price and portfolio weight and employ a disciplined rebalancing mechanism. From there a lot of fun can be had talking about the different risk factors that can serve as the basis for these methodologies, but it is important to remember the two basic ingredients that lie at the core of all smart beta strategies: weighting by non-price-related measures and systematic rebalancing. ‘Naïve’ doesn’t necessarily mean balanced The simplest of smart beta methodologies is widely accepted to be equal weighting. This technique is commonly referred to as ‘naïve’ as it entails allocating the same weight to each constituent in the index and regularly rebalancing back to base weights. Why is this approach described as ‘naïve’? Because it does not make any assumptions about the index constituents (their size, prospects for future return, etc.) but instead simply weights them all equally. While traditional equal weighting certainly contains the basic ingredients of smart beta -non-price-weighted and systematically rebalanced – it also introduces static sector biases since the weight allocated to each sector is determined solely by the number of companies in the sector. For example, if an index contains 100 financial stocks and 50 technology stocks, the portfolio weight in financials would be double that of technology, regardless of the relative size between the two sectors. The number of companies in a given sector alone is unlikely to be related to the relative prospects of that sector versus others, yet a simple constituent equal-weight strategy will statically allocate more (in some cases substantially!) weight to some sectors than others for the arbitrary reason of the difference in the number of constituents. For example, as seen in Figure 1, the constituent equal-weight approach employed in the S&P 500 Equal Weight Index results in significant sector concentration, with three of the 10 sectors (financials, consumer discretionary and industrials) consistently comprising between 44% and 47% of the weight of the portfolio during the last 10 years. In fact, in some cases constituent equal weighting can introduce greater sector-specific risk than capitalization weighting, as demonstrated by Figure 2. If one were to take a constituent equal-weight approach to the Russell 1000 Index, that would result in an allocation of 22.2% of the portfolio to the financial services sector versus just 4.8% to consumer staples – a spread of over 17%. An alternative to constituent equal weighting is the approach that Russell Indexes takes with its Russell 1000 Equal Weight Index. The firm initially equally weights the sectors (at each quarterly rebalance 11.1% is allocated to each of the nine sectors within the Russell Global Sector classification system) and then follows that by equally weighting the constituents within each sector. This results in a portfolio that we believe is both “naïve” from a sector and constituent level and helps mitigate the sector biases inherent in a constituent equal-weight approach. This methodology also enables the index to contra-trade against the most recent price movements at the sector level as well as at the constituent level as the index rebalances. While clearly aligning with the basic elements of smart beta – the traditional equal-weight approach may not be as diversified as many investors think, and it may, in fact, be introducing unintended sector-specific risk to an investment portfolio. Employing sector equal weighting followed by constituent equal weighting in the rebalancing process is an approach that we believe ultimately results in a better way to distribute risk across the portfolio. EXHIBITS: Figure 1: S&P 500 Equal Weight Index – Sector Composition through time Source: Global ETF Products & Research with underlying data from FactSet; Data as of Dec. 31, 2014 Figure 2: Russell 1000 Sector Allocation Comparison Source: Russell Investments as of Dec. 22, 2014. The Russell 1000® Index is an unmanaged index considered representative of large-cap stocks. The Russell 1000® Index is a trademark/ service mark of the Frank Russell Co. Russell® is a trademark of the Frank Russell Co. The Russell 1000® Equal Weight Index is a trademark of Frank Russell Company and has been licensed for use by Invesco PowerShares. The Product is not sponsored, endorsed, sold or promoted by Frank Russell Company and Frank Russell Company makes no representation regarding the advisability of investing in the Product. An investment cannot be made directly into an index. *Russell 1000 CEW is not an actual index, but illustrates how the Russell 1000 Index could look under a constituent equal-weighting approach. To create this hypothetical index, equal weight was given to each constituent of the Russell 1000 Index, using the index’s holdings as of Dec. 22, 2014. Important Information The Russell Global Sector classification system categorizes stocks into nine sectors: technology, health care, consumer discretionary, consumer staples, energy, materials and processing, producer durables, financial services and utilities. As the index rebalances back to base weights, it increases weight in those sectors/stocks that have decreased in price while decreasing weight in those sectors/stocks that have increased in price – thus contra-trading against recent market movements. The S&P 500 Equal Weight Index is the equally weighted version of the S&P 500 Index. The S&P 500 Index is an unmanaged index considered representative of the U.S. stock market. Before investing, investors should carefully read the prospectus/ summary prospectus and carefully consider the investment objectives, risks, charges and expenses. For this and more complete information about the Funds call 800 983 0903 or visit invescopowershares.com for prospectus/summary prospectus. Diversification does not guarantee a profit or eliminate the risk of loss. Beta is a measure of risk representing how a security is expected to respond to general market movements. Smart Beta represents an alternative and selection index based methodology that seeks to outperform a benchmark or reduce portfolio risk, or both. Smart beta funds may underperform cap-weighted benchmarks and increase portfolio risk. There are risks involved with investing in ETFs, including possible loss of money. Index-based ETFs are not actively managed. Actively managed ETFs do not necessarily seek to replicate the performance of a specified index. Both index-based and actively managed ETFs are subject to risks similar to stocks, including those related to short selling and margin maintenance. Ordinary brokerage commissions apply. The Fund’s return may not match the return of the underlying index. Investments focused in a particular industry are subject to greater risk, and are more greatly impacted by market volatility than more diversified investments. The Global Industry Classification Standard was developed by and is the exclusive property and a service mark of MSCI, Inc. and Standard & Poor’s. The information provided is for educational purposes only and does not constitute a recommendation of the suitability of any investment strategy for a particular investor. Invesco does not provide tax advice. The tax information contained herein is general and is not exhaustive by nature. Federal and state tax laws are complex and constantly changing. Investors should always consult their own legal or tax professional for information concerning their individual situation. The opinions expressed are those of the authors, are based on current market conditions and are subject to change without notice. These opinions may differ from those of other Invesco investment professionals. NOT FDIC INSURED MAY LOSE VALUE NO BANK GUARANTEE All data provided by Invesco unless otherwise noted. Invesco Distributors, Inc. is the U.S. distributor for Invesco Ltd.’s retail products and collective trust funds. Invesco Advisers, Inc. and other affiliated investment advisers mentioned provide investment advisory services and do not sell securities. Invesco Unit Investment Trusts are distributed by the sponsor, Invesco Capital Markets, Inc., and broker-dealers including Invesco Distributors, Inc. PowerShares® is a registered trademark of Invesco PowerShares Capital Management LLC (Invesco PowerShares). Each entity is an indirect, wholly owned subsidiary of Invesco Ltd. ©2014 Invesco Ltd. All rights reserved. blog.invesco.us.com