Tag Archives: alternative

Investing For Retirement Using T. Rowe Price Mutual Funds
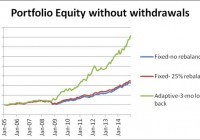
Summary T. Rowe Price offers a set of high-performing mutual funds which can be successfully used for construction of investment portfolios with good withdrawal rates. From January 2005 to December 2014, a T. Rowe Price portfolio with fixed allocation could produce a safe 5% annual withdrawal rate and 7.84% annual increase of the capital. Same portfolio with rebalancing at 25% deviation from the target allowed a safe 5% annual withdrawal rate and achieved 8.48% compound annual increase of the capital. Better performance could be achieved using adaptive asset allocation. Same portfolio could have produced a safe 15% annual withdrawal rate and 6.58% annual increase of the capital. The drawdowns of the portfolios are relatively small considering their high returns. This article belongs to a series of articles dedicated for investing in various mutual fund families. In previous articles, we reported our research on Fidelity and Vanguard mutual fund families. The current article does the same for T. Rowe Price family of mutual funds. Four mutual funds have been selected for investment. They are the following: T. Rowe Price U.S. Treasury Long-Term Bond Fund (MUTF: PRULX ) T. Rowe Price Health Sciences Fund (MUTF: PRHSX ) T. Rowe Price Media And Telecommunications Fund (MUTF: PRMTX ) T. Rowe Price Global Technology Fund (MUTF: PRGTX ) In this article, three different strategies will be considered: (1) Fixed asset allocation: The portfolio is initially invested 40% in the bond fund and 60% equally divided between the stock funds, without rebalancing. (2) Target asset allocation with rebalancing: The portfolio is initially invested 40% in the bond fund and 60% equally divided between the stock funds and is rebalanced when the allocation to any fund deviates by 25% from its target. (3) Momentum-based adaptive asset allocation: The portfolio is at all times invested 100% in only one fund. The switching, if necessary, is done monthly at closing of the last trading day of the month. All money is invested in the fund with the highest return over the previous 3 months. The data for the study were downloaded from Yahoo Finance on the Historical Prices menu for four tickers: PRULX, PRHSX, PRMTX, and PRGTX. We use the monthly price data from January 2005 to December 2014, adjusted for dividend payments. The paper is made up of two parts. In part I, we examine the performance of portfolios without any income withdrawal. In part II, we examine the performance of portfolios when income is extracted periodically from the accounts. Part I: Portfolios without withdrawals In Table 1, we show the results of the portfolios managed for 10 years, from January 2005 to December 2014. Table 1. Portfolios without withdrawals 2005-2014 Strategy Total increase% CAGR% Number trades MaxDD% Fixed-no rebalance 228.89 12.64 0 -28.82 Target-25% rebalance 247.01 13.25 4 -24.54 Adaptive 714.50 23.33 52 -11.57 The time evolution of the equity in the portfolios is shown in Figure 1. (click to enlarge) Figure 1. Equities of portfolios without withdrawals Source: This chart is based on Excel calculations using the adjusted monthly closing share prices of securities From Figure 1, it is apparent that the rate of increase of the adaptive portfolio is substantially greater than the rate of the fixed and target allocation portfolios. Part II: Portfolios with withdrawals Assume that we invest $1,000,000 for income in retirement. We plan to withdraw monthly a fixed percentage of the initial investment. That amount is increased by 2% annually in order to account for inflation. In Table 2, we show the results of the portfolios managed for 10 years, from January 2005 to December 2014. Money was withdrawn monthly at a 5% annual rate of the initial investment, plus a 2% inflation adjustment. Over the 10 years from January 2005 to December 2014, a total of $535,920 was withdrawn. Table 2. Portfolios with 5% annual withdrawal rate 2005-2014 Strategy Total increase% CAGR% Number trades MaxDD% Fixed-no rebalance 128.08 7.84 0 -30.71 Target-25% rebalance 127.68 8.48 4 -29.65 Adaptive 297.64 19.74 52 -14.08 The time evolution of the equity in the portfolios is shown in Figure 2. (click to enlarge) Figure 2. Equities of portfolios with 5% annual withdrawal rates Source: This chart is based on Excel calculations using the adjusted monthly closing share prices of securities To illustrate the effect of the withdrawal rates on the evolution of the capital, we report simulation results for two strategies: fixed target with rebalancing and momentum-based adaptive asset allocation. In Table 3, we report the results of simulations of the fixed target portfolio with the following withdrawal rates: 0%, 5%, 6%, 8%, and 10%. Table 3. Fixed Target Portfolios with rebalancing at 25% deviations for various annual withdrawal rates 2005-2014 Withdrawal rate % Total increase% CAGR% MaxDD% 0 247.00 13.25 -24.54 5 125.77 8.48 -29.65 6 95.96 6.96 -31.23 8 51.06 4.21 -34.16 10 1.32 0.13 -37.14 The time evolution of the equity in the portfolios is shown in Figure 3. (click to enlarge) Figure 3. Equities of fixed target portfolios with rebalancing at 25% deviation from targets and 5% annual withdrawal rates Source: This chart is based on Excel calculations using the adjusted monthly closing share prices of securities To illustrate the advantage of the adaptive allocation strategy and the effect of withdrawal rates on the evolution of the capital, we give in Table 4 the results of simulations for the following withdrawal rates: 0%, 5%, 10%, and 15%. Table 4. Adaptive Portfolios with various annual withdrawal rates 2005-2014 Withdrawal rate % Total increase% CAGR% MaxDD% 0 714.50 23.33 -11.57 5 506.07 19.74 -14.08 10 297.64 14.80 -19.05 15 89.21 6.58 -30.72 The time evolution of the equity in the portfolios is shown in Figure 4. (click to enlarge) Figure 4. Equities of momentum-based portfolios with various annual withdrawal rates Source: This chart is based on Excel calculations using the adjusted monthly closing share prices of securities Conclusion The set of four mutual funds, selected for this study, perform exceptionally well for all three strategies and generate high returns at relatively low drawdowns. Between 2005 and 2015, the fixed target allocation with rebalancing was able to sustain withdrawal rates of up to 10% annually. The adaptive allocation algorithm was able to sustain withdrawal rates up to 15% annually without any decrease of capital. Disclosure: The author has no positions in any stocks mentioned, and no plans to initiate any positions within the next 72 hours. (More…) The author wrote this article themselves, and it expresses their own opinions. The author is not receiving compensation for it (other than from Seeking Alpha). The author has no business relationship with any company whose stock is mentioned in this article. Additional disclosure: This article is the third in a sequence on investing in mutual funds for retirement accounts. To help the reader compare the past performance of various mutual fund families, I selected a benchmark 10-year time interval starting on 1 January 2005 and ending on 31 December 2014. The article was written for educational purposes and should not be considered as specific investment advice.

Is Cheap Oil Driving Transport Earnings And ETFs?

Transportation stocks have been the biggest beneficiaries of cheaper oil and an improving U.S. economy. This is easily reflected in their Q4 results as total earnings from 72.8% of the sector’s total market capitalization reported so far are up 20.6% on 5.5% revenue growth. Earnings surprises were impressive with 72.8% of the companies beating earnings estimates with a median surprise of 3.3 and 57.1% beating revenues with a median surprise of 0.4. In particular, earnings from several big players in the space like Union Pacific (NYSE: UNP ), Kansas City Southern (NYSE: KSU ), CSX Corp. (NYSE: CSX ), Delta Air Lines (NYSE: DAL ) and United Continental (NYSE: UAL ) have been encouraging. However, sluggish outlook from the bellwether United Parcel Service (NYSE: UPS ) had severely affected the broad space, erasing most of the stock gains made in the year. Transportation Earnings in Focus Earnings at the world’s largest package delivery company – UPS – were on par with the Zacks Consensus Estimate of $1.25 while revenues of $15.9 billion were marginally ahead of our estimate of $15.8 billion. The company projects earnings per share of $5.05-$5.30 for fiscal 2015, representing 6-12% growth on an annual basis. The mid-point is above the Zacks Consensus Estimate of $5.14. Further, the company reaffirmed its long-term earnings per share growth target of 9-13%. The share price of UPS grew about 0.4% on the day of its earnings release on February 2. The two largest U.S. airlines – DAL and UAL – flew higher after beating the Zacks Consensus Estimate on the earnings front. Both stocks surged 11.4% and 7.7% to touch new 52-week highs of $51.06 and $74.52, respectively, before being hit by UPS’ warnings. DAL is just up 0.4% to date since its earnings release on January 20 and UAL is down 1.8% following its earnings release on January 22. Earnings at Delta beat the Zacks Consensus Estimate by three cents while revenues of $9.65 billion edged past our estimate of $9.59 billion. On the other hand, earnings at United Continental came in at $1.20, outpacing our estimate by six cents, and revenues were $9.3 billion, on par with our estimate. UNP , the U.S. largest railroad, reported earnings of $1.61 per share, 10 cents ahead of the Zacks Consensus Estimate and 27% higher than the year-ago earnings. Revenues climbed 9% year over year to $6.2 billion, ahead of our estimate of $6.1 billion. The stock climbed 6.4% since its earnings announcement on January 22 before the market opened. Other major railroads like CSX and KSU have given mixed performances. While earnings at CSX meets our estimate of 49 cents, revenue of $3.19 billion exceed the Zacks Consensus Estimate of $3.18 billion. On the other hand, KSU earnings outpaced by 4 cents and revenues of $643 million lagged the Zacks Consensus Estimate of $658 million. Shares of CSX gained 3.3% to date post earnings on January 13 after the closing bell and KSU added nearly 1% since its earnings announcement on January 23 before the market opened. ETFs in Focus Given that the cheap fuel will continue to provide a big boost to transport earnings growth, investors should definitely tap the current beaten down prices in the form of ETFs with a lower level of risk. This is especially true as the transport sector actually has the best rank for any industry at the time of writing – about three-fourths of the industries under transport have Zacks Ranks in the top 37%, suggesting bullishness in the sector. iShares Dow Jones Transportation Average Fund (NYSEARCA: IYT ) The ETF tracks the Dow Jones Transportation Average Index, giving investors exposure to the small basket of 20 securities. The fund has a certain tilt toward large cap stocks at 49% while mid and small caps account for 31% and 19% share, respectively, in the basket. The product is heavily concentrated on the top five holdings, accounting for 42.8% of assets. From a sector perspective, railroad takes the top spot with less than half share in the basket, while air freight & logistics and airlines round off to the top three with double-digit exposure each. The fund has accumulated nearly $2 billion in AUM while sees good trading volume of around 490,000 shares a day. It charges 43 bps in annual fees and has lost 2.6% so far in the year. SPDR S&P Transportation ETF (NYSEARCA: XTN ) This fund uses the equal weight methodology to each security by tracking the S&P Transportation Select Industry Index. Holding 50 stocks in its basket with AUM of $623.4 million, each security accounts for less than 3.3% of total assets. The ETF is skewed toward small caps at 51% while mid and large caps account for 27% and 22% share, respectively. About one-third of the portfolio is dominated by trucking while airlines take another one-fourth share. Airfreight & logistics, and railroads also make up for a double-digit allocation. The fund charges 35 bps in fees per year from investors and trades in a moderate volume of more than 82,000 shares a day. XTN is down about 5.8% in the year-to-date timeframe. Bottom Line Investors should keep in mind that cheap fuel is currently a huge boon to the transportation sector. Better job conditions and an improving economy are also driving the growth in the sector. As a result, investors shouldn’t miss this opportunity to stuff these funds into their portfolio. Further, these funds could easily counter shocks from some of the industry’s biggest components like the recent UPS warnings.

Best And Worst ETFs Of January

The year 2015 began on quite a volatile note and in fact saw the worst start to the New Year since 2008. Standard & Poor’s 500 index fell 3.1% in January while the Dow Jones Industrial Average lost 3.7% – marking its biggest monthly loss in a year. Concerns about the impact of a stronger dollar and lower oil prices on corporate earnings growth continued to bother investors. Moreover, global growth uncertainty also played foul with both the World Bank and International Monetary Fund having slashed their global growth forecasts. The three factors – oil, the strengthening U.S. dollar and lackluster global economic growth – worked in tandem pushing down corporate profitability for Q4 and the estimates for the current and subsequent quarters. Meanwhile, the Swiss National Bank dropped its long-standing exchange rate of the Swiss franc against the euro adding to the current market volatility. At the same time, the political situation in Greece worsened as the Syriza party won the country’s general elections, raising worries about Greece’s exit from the Euro zone. On the other hand, news that the U.S. consumer sentiment rose in January to its highest level in 11 years on better job and wage prospects and consumer spending in the fourth quarter expanded at the fastest pace since 2006 failed to bring in the much need relief to the U.S. markets. Adding to the woes, the U.S. economy expanded at a slower-than-expected pace of 2.6% during the final quarter of 2014. The pace signaled a slowdown in growth after an expansion of 5% in the third quarter and the 4.6% pace in the second. Given the huge market volatility, ultra-safe bond funds emerged as one of the biggest winners in January as investors rushed in for safety. Not surprisingly, some of the commodity and oil & gas ETFs emerged as losers shedding in the double digits. Best ETFs Volatility ETFs Volatility ETFs were the major gainers amid the ongoing turbulence, as these tend to outperform when markets are falling or fear levels are high for the future. The iPath S&P 500 VIX Short-Term Futures ETN (NYSEARCA: VXX ) has been leading the space with a 17% return in January, closely followed by 16.89% for the C-Tracks Citi Volatility Index ETN (NYSEARCA: CVOL ). VXX is the most popular volatility ETN on the market with an asset base of $937.7 million and average trading volume of 43.1 million shares. The fund tracks the S&P 500 VIX Short-Term Futures Index to provide exposure to a daily rolling long position in the first and second months of VIX futures contracts. The expense ratio came in at 0.89%. Bond ETFs Given the uncertainty in the global market, investors are flocking to safe haven long-term government bonds to protect their portfolio from losses. The PIMCO 25+ Year Zero Coupon U.S. Treasury Index ETF (NYSEARCA: ZROZ ), the Vanguard Extended Duration Treasury ETF (NYSEARCA: EDV ) and the iShares 20+ Year Treasury Bond ETF (NYSEARCA: TLT ) emerged as some of the biggest winners in this space gaining in excess of 9%. ZROZ tracks the BofA Merrill Lynch Long US Treasury Principal STRIPS index and holds 21 securities in its basket. The effective maturity and effective duration of the fund stand at 27.38 years. The fund manages an asset base of $164.2 million and charges 15 bps in annual fees. ZROV has a 30-day SEC yield of 2.30% and is up 16% quarter-to-date. iShares Residential Real Estate Capped ETF (NYSEARCA: REZ ) In the current ultra-low environment, investors in search of juicy yields are continuing to pile up real estate funds which offer attractive payouts. The fund follows the FTSE NAREIT All Residential Capped Index and provides exposure to 37 U.S. residential real estate stocks and real estate investment trusts (REITs). REZ manages an asset base of $347.2 million with a 30-day SEC yield of 3.18% and has returned 8% in the past one month. ETF Losers SPDR S&P Metals & Mining ETF (NYSEARCA: XME ) XME was the biggest loser last month dragged down by weakness within the broad commodity space. The fund lost 12.1% in January and is down 31% in the past one year. XME is the largest and most popular fund in the metals and mining space with an asset base of $370.6 million and is highly liquid with an average trading volume of 2 million shares. The fund tracks the S&P Metals & Mining Select Industry Index to provide exposure to a basket of 35 stocks. The ETF charges 35 basis points a year. SPDR S&P Oil & Gas Equip & Service (NYSEARCA: XES ) The persistent decline in oil prices over the past six months has taken a toll on the overall energy sector as well as on the growth prospects of a number of oil producers. XES tracks the S&P Oil & Gas Equipment & Services Select Industry Index providing exposure to a basket of 52 stocks. Sector-wise, Oil & Gas Equipment & Services occupies 72.3% of fund assets followed by 27.7% to Oil & Gas Drilling. The fund manages an asset base of $169.5 million and has lost 11.5% last month. The fund currently has a Zacks ETF Rank #5 or Sell rating. First Trust ISE-Revere Natural Gas Index Fund (NYSEARCA: FCG ) The fund offers exposure to the U.S. stocks that derive a substantial portion of their revenues from the exploration and production of natural gas. It follows the ISE-Revere Natural Gas Index and holds 28 stocks in its basket, which are well spread out across each component with none holding more than 7% of assets. The fund has gathered an AUM of $240 million so far and sees good average daily volume of over 1.3 million shares. The fund has shed 10.5% in January and currently has a Zacks ETF Rank #5 or Sell rating.