Tag Archives: prgtx

Best Performing T. Rowe Price Mutual Funds Of Q2 2015

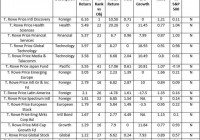
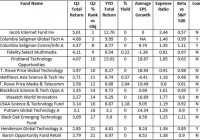
The best second quarter performer from a T. Rowe Price (NASDAQ: TROW ) mutual fund was not robust, but sufficient in a tough quarter where broader markets struggled to maintain a seat in the positive zone. Though T. Rowe Price’s best gain of 6.2% lagged key players like Fidelity , PIMCO and Franklin/Temp , the fund family managed to post better gains than peers including Oppenheimer (NYSE: OPY ), Lord Abbett and Vanguard Group. T. Rowe Price’s quarterly gain is short of the second quarter’s top performer the ProFunds UltraChina (MUTF: UGPIX ) which managed a gain of almost 16%. Also, gains look very modest going beyond the top 10 of the T. Rowe Price performers. However, if we look at broader markets then we do notice the dismal trend. There were only 15 funds (excluding same funds of different classes) that could post above a 10% gain in the second quarter, reflecting the muted quarterly performance. Also, only four of the mutual fund categories could post above a 10% gain in the first half. Just 41% of mutual funds could manage to finish in the green in the second quarter. This is less than half of the 81% gains scored by mutual funds in the first quarter. These losses however owed a lot to the selloff on the eve of the quarter’s end. Of the 181 T. Rowe Price mutual funds under the study, 98 funds finished in the green while 2 funds, the T. Rowe Price Global Allocation Fund (MUTF: PAFGX ) and the T. Rowe Price Institutional Global Growth Equity Fund (MUTF: RPIGX ), had a break even return. Average gain for the 98 funds stood at 1.04%. The other 79 funds ended in the red with an average loss of 1.22%. Only 6 funds had above 5% loss, with the largest loss reaching 9.95%, coming from the T. Rowe Price Real Estate Fund (MUTF: PAREX ). (Note: This number includes funds from same classes). T. Rowe Price’s Second Quarter Wrap Up T. Rowe Price notes that Greek debt crisis concerns had offset the “resilient corporate earnings growth and enthusiasm about a reaccelerating U.S. economy” to drag Dow down to the red in the second quarter. Among the major benchmarks, small caps outperformed while mid caps had the worst performance. Winter Slowdown is Momentary : T. Rowe Price Chief U.S. Economist Alan Levenson noted that the winter effect was partly to be blamed. However, while winter caused some hiring weakness and the West Coast ports strike added to concerns, job growth gathered steam in April and May. While initial claims had dropped to a 15-year low, wage gains and consumer spending also reflected strong trends. Timing of the Fed Rate Hike : The winter effect had pushed back expectations for the first rate hike. The Fed minutes from the April’s policy meeting noted that the winter effect made it “unlikely” for Fed to raise rates in June. The number of members anticipating rate hike increased in June meeting. Greece : The quarter ended on a dismal note largely due to the Greek debt concerns. Greece and its creditors continued negotiations about the repayment of debt. Greece had proposed bundling several debt repayments to the IMF. On Jun 29, US markets had the steepest daily decline since Oct 2014 as Greece shut down banks and the stock market. Top 15 Gainers of Q2 2015 T. Rowe Price is one of the world’s leading investment management companies. Founded in 1937 by Thomas Rowe Price, Jr, the company offers a wide range of mutual funds, sub-advisory and separate account management services for both individual and institutional investors. It relies on fundamental research and a disciplined approach to provide a full range of investment strategies. The company’s strict adherence to stated investment objectives ensures the long term integrity of its client portfolios. Below we present the top 15 T. Rowe Price funds with best returns of Q2 2015: (click to enlarge) Note: The list excludes the same funds with different classes, and institutional funds have been excluded. Funds having minimum initial investment above $5000 have been excluded. Q2 % Rank vs Objective* equals the percentage the fund falls among its peers. Here, 1 being the best and 99 being the worst. The trend emanating is that a diversified group of funds has managed to feature in the top 15 performers’ list. Though there is yet again a domination of foreign funds, they are from varied regions. The top gainer the T . Rowe Price International Discovery Fund (MUTF: PRIDX ), and funds such as the T. Rowe Price International Growth And Income Fund (MUTF: TRIGX ) and the T. Rowe Price Global Stock Fund (MUTF: PRGSX ), invest in non-US instruments and are not restricted to particular regions. The diversity is also prominent from other funds such as the T. Rowe Price Japan Fund (MUTF: PRJPX ), the T. Rowe Price Emerging Europe Fund (MUTF: TREMX ), the T. Rowe Price European Stock Fund (MUTF: PRESX ), the T. Rowe Price Latin America Fund (MUTF: PRLAX ) and the T. Rowe Price Africa & Middle East Fund (MUTF: TRAMX ). International bond fund, the T. Rowe Price Emerging Markets Corporate Bond Fund (MUTF: TRECX ) also made it to the list. Here, PRIDX, PRGSX and TRECX carry a Zacks Mutual Fund Rank #1 (Strong Buy) . TRIGX has a Zacks Mutual Fund Rank #2 (Buy) . While PRJPX holds a Zacks Mutual Fund Rank #3 (Hold), PRLAX and TRAMX carry a Zacks Mutual Fund Rank #4 (Sell) and a Zacks Mutual Fund Rank #5 (Strong Sell). Among the other categories, Health, Financial, Technology and Growth funds were also among the top 15 gainers. These included the T. Rowe Price Health Sciences Fund (MUTF: PRHSX ) from Healthcare category, the T. Rowe Price Financial Services Fund (MUTF: PRISX ) from the T. Rowe Price Global Technology Fund (MUTF: PRGTX ) and the T. Rowe Price Media And Telecommunications Fund (MUTF: PRMTX ) from Tech category, and the T. Rowe Price Mid-Cap Growth Fund (MUTF: RPMGX ) from growth category. PRHSX, which carries a Zacks Mutual Fund Rank #2, was also one of the best performing healthcare mutual funds of Q2 2015 . Also, both PRGTX and PRMTX were among the best performing technology mutual funds of Q2 2015. Link to the original article on Zacks.com

Best Performing Technology Mutual Funds Of Q2 2015

The technology sector’s earnings results have not been very encouraging this time. For the week ending Jul 17th, a good deal of tech results drove markets as earnings results and management commentary were mostly positive. However, the following week many earnings reports dampened investor sentiment. Apple did beat expectations although the surprise wasn’t as dramatic as it has been in the past. Nonetheless, excluding Apple, the tech sector’s earnings performance was weaker. In regard to mutual funds, Morningstar data showed that Technology sector mutual funds gained 1.64%. Though this return looks dismal, its compares favorably with the fact that it was one of the 6 among 15 Sector Equity Funds to have finished in the green. While it was the 5th best gainer among the Sector Equity Funds category, the technology sector ranked 14th among all categories of funds. Markets had a dismal run in the second quarter; wherein the S&P 500 and Dow declined 0.2% and 0.9%, however the Nasdaq did gain 1.8%. In the first half of 2015, fund inflow slumped 36% year on year to $143 billion. This significant decline was largely due to the dismal trend in the second quarter; wherein inflows were down to $41 billion through Jun 17, comparing unfavorably with the $102 billion of inflows in the first quarter. Tech Q2 versus Q1 Performance Coming back to the tech sector, 126 funds out of the 201 funds under the study finished in positive territory. The average gain for these 126 funds was 2.4%. While one fund had break even return, the remaining 74 funds posted an average loss of 1.2%. As for individual technology mutual funds, the best gain was 9%, which came from the ProFunds UltraSector Mobile Telecommunication Fund (MUTF: WCPIX ) . WCPIX requires a minimum initial investment of $15000. The J acob Internet Fund (MUTF: JAMFX ) was the next best gainer. JAMFX gained almost 6% and it has a minimum initial investment of $2500. Looking back at the first quarter performance, the tech sector’s gain was 3% compared to 1.64% this time. WCPIX was also the best gainer in the first quarter by gaining 13.2%. However, WCPIX has not been able to continue the momentum and has lost over 3.3% in July. The Firsthand Technology Opportunities Fund (MUTF: TEFQX ) was the next best gainer in the first quarter and had gained 8.6%. Of the 199 funds under the study in the first quarter, 184 funds had finished in positive zone with an average gain of 3.6%. One fund had break even return, and the 14 funds that finished in the red had average loss of 1.2%. Returns from the top 15 technology funds in the first quarter were also decently above the sector’s 3% return. The average gain for these top 15 performers in first quarter was 5.7%. The average gain of the best 15 fund performers for the second quarter stood at 3.7%, a decent decline from the first quarter performance. The Tech Sector’s Q2 Scorecard (as of Jul 29) Total earnings for the 75.6% of the Tech sector’s market cap in the S&P 500 that have reported results are up 1.9% on 3.5% higher revenues, with 67.6% beating EPS estimates and 55.9% coming ahead of revenue estimates. The sector’s earnings and revenue surprises are about in-line with other historical periods, though the growth rates are notably on the weak side, despite Apple’s (NASDAQ: AAPL ) strong contribution. Once again, Apple plays a key role in the sector’s result. Taking Apple out, the technology sector’s earnings would be down 6% on 2.1% lower revenues. However, Apple’s results and guidance were not enough to impress investors this time. Revenue guidance came in short of the street. The year-over-year comps were all good (except iPad, which dropped to its lowest level in four years), but some of the sequential comps and the billion dollar capex reduction could indicate weakness. As for other key players, Intel’s results were helped by a higher gross margin, higher other income and lower tax rate. For Netflix, international revenue strength was greater than domestic, although both were up double-digits. Foreign exchange headwinds affected Google. The company has a sizeable international business, so the impact of the stronger dollar can’t always be mitigated by its hedging programs. Yahoo’s second-quarter revenue exceeded the Zacks Consensus Estimate although earnings fell short. Top 15 Technology Mutual Funds of Q2 2015 Below we present the top 15 Technology mutual funds with best returns of Q2 2015: (click to enlarge) Note: The list excludes the same funds with different classes, and institutional funds have been excluded. Funds having minimum initial investment above $5000 have been excluded. Q2 % Rank vs Objective* equals the percentage the fund falls among its peers. Here, 1 being the best and 99 being the worst. A good thing about the list is that the majority of these funds carry favorable Zacks Mutual Fund Rank . This heightens the possibility of these funds continuing their uptrend. Remember, the goal of the Zacks Mutual Fund Rank is to guide investors to identify potential winners and losers. Unlike most of the fund-rating systems, the Zacks Mutual Fund Rank is not just focused on past performance, but the likely future success of the fund. The Columbia Seligman Global Technology Fund (MUTF: SHGTX ), the T. Rowe Price Global Technology Fund (MUTF: PRGTX ), the BlackRock Science & Technology Opportunities Portfolio (MUTF: BGSAX ) and the USAA Science and Technology Fund (MUTF: USSCX ) carry a Zacks Mutual Fund Rank #1 (Strong Buy). Meanwhile, the Columbia Seligman Communications and Information Fund (MUTF: SLMCX ), the Fidelity Select Multimedia Portfolio (MUTF: FBMPX ), the Matthews Asia Science and Technology Fund (MUTF: MATFX ), the Putnam Global Technology Fund (MUTF: PGTAX ) and the Black Oak Emerging Technology Fund (MUTF: BOGSX ) currently hold a Zacks Mutual Fund Rank #2 (Buy). Among these funds, SHGTX, PRGTX, MATFX, BGSAX, USSCX had also featured in the list of best performing technology mutual funds for the first quarter. Jacob Internet Fund Inv and Firsthand Technology Opportunities have also managed to feature in both the lists. However, while JAMFX carries a Zacks Mutual Fund Rank #4 (Sell), TEFQX holds a Zacks Mutual Fund Rank #5 (Strong Sell). Funds such as the T. Rowe Price Media And Telecommunications Fund (MUTF: PRMTX ) , the Henderson Global Technology Fund (MUTF: HFGAX ) and the Baron Opportunity Fund (MUTF: BIOPX ) also carry a Zacks Mutual Fund Rank #4. Separately, the Wasatch World Innovators Fund (MUTF: WAGTX ) has a Zacks Mutual Fund Rank #3 (Hold). Link to the original post on Zacks.com

Investing For Retirement Using T. Rowe Price Mutual Funds

Summary T. Rowe Price offers a set of high-performing mutual funds which can be successfully used for construction of investment portfolios with good withdrawal rates. From January 2005 to December 2014, a T. Rowe Price portfolio with fixed allocation could produce a safe 5% annual withdrawal rate and 7.84% annual increase of the capital. Same portfolio with rebalancing at 25% deviation from the target allowed a safe 5% annual withdrawal rate and achieved 8.48% compound annual increase of the capital. Better performance could be achieved using adaptive asset allocation. Same portfolio could have produced a safe 15% annual withdrawal rate and 6.58% annual increase of the capital. The drawdowns of the portfolios are relatively small considering their high returns. This article belongs to a series of articles dedicated for investing in various mutual fund families. In previous articles, we reported our research on Fidelity and Vanguard mutual fund families. The current article does the same for T. Rowe Price family of mutual funds. Four mutual funds have been selected for investment. They are the following: T. Rowe Price U.S. Treasury Long-Term Bond Fund (MUTF: PRULX ) T. Rowe Price Health Sciences Fund (MUTF: PRHSX ) T. Rowe Price Media And Telecommunications Fund (MUTF: PRMTX ) T. Rowe Price Global Technology Fund (MUTF: PRGTX ) In this article, three different strategies will be considered: (1) Fixed asset allocation: The portfolio is initially invested 40% in the bond fund and 60% equally divided between the stock funds, without rebalancing. (2) Target asset allocation with rebalancing: The portfolio is initially invested 40% in the bond fund and 60% equally divided between the stock funds and is rebalanced when the allocation to any fund deviates by 25% from its target. (3) Momentum-based adaptive asset allocation: The portfolio is at all times invested 100% in only one fund. The switching, if necessary, is done monthly at closing of the last trading day of the month. All money is invested in the fund with the highest return over the previous 3 months. The data for the study were downloaded from Yahoo Finance on the Historical Prices menu for four tickers: PRULX, PRHSX, PRMTX, and PRGTX. We use the monthly price data from January 2005 to December 2014, adjusted for dividend payments. The paper is made up of two parts. In part I, we examine the performance of portfolios without any income withdrawal. In part II, we examine the performance of portfolios when income is extracted periodically from the accounts. Part I: Portfolios without withdrawals In Table 1, we show the results of the portfolios managed for 10 years, from January 2005 to December 2014. Table 1. Portfolios without withdrawals 2005-2014 Strategy Total increase% CAGR% Number trades MaxDD% Fixed-no rebalance 228.89 12.64 0 -28.82 Target-25% rebalance 247.01 13.25 4 -24.54 Adaptive 714.50 23.33 52 -11.57 The time evolution of the equity in the portfolios is shown in Figure 1. (click to enlarge) Figure 1. Equities of portfolios without withdrawals Source: This chart is based on Excel calculations using the adjusted monthly closing share prices of securities From Figure 1, it is apparent that the rate of increase of the adaptive portfolio is substantially greater than the rate of the fixed and target allocation portfolios. Part II: Portfolios with withdrawals Assume that we invest $1,000,000 for income in retirement. We plan to withdraw monthly a fixed percentage of the initial investment. That amount is increased by 2% annually in order to account for inflation. In Table 2, we show the results of the portfolios managed for 10 years, from January 2005 to December 2014. Money was withdrawn monthly at a 5% annual rate of the initial investment, plus a 2% inflation adjustment. Over the 10 years from January 2005 to December 2014, a total of $535,920 was withdrawn. Table 2. Portfolios with 5% annual withdrawal rate 2005-2014 Strategy Total increase% CAGR% Number trades MaxDD% Fixed-no rebalance 128.08 7.84 0 -30.71 Target-25% rebalance 127.68 8.48 4 -29.65 Adaptive 297.64 19.74 52 -14.08 The time evolution of the equity in the portfolios is shown in Figure 2. (click to enlarge) Figure 2. Equities of portfolios with 5% annual withdrawal rates Source: This chart is based on Excel calculations using the adjusted monthly closing share prices of securities To illustrate the effect of the withdrawal rates on the evolution of the capital, we report simulation results for two strategies: fixed target with rebalancing and momentum-based adaptive asset allocation. In Table 3, we report the results of simulations of the fixed target portfolio with the following withdrawal rates: 0%, 5%, 6%, 8%, and 10%. Table 3. Fixed Target Portfolios with rebalancing at 25% deviations for various annual withdrawal rates 2005-2014 Withdrawal rate % Total increase% CAGR% MaxDD% 0 247.00 13.25 -24.54 5 125.77 8.48 -29.65 6 95.96 6.96 -31.23 8 51.06 4.21 -34.16 10 1.32 0.13 -37.14 The time evolution of the equity in the portfolios is shown in Figure 3. (click to enlarge) Figure 3. Equities of fixed target portfolios with rebalancing at 25% deviation from targets and 5% annual withdrawal rates Source: This chart is based on Excel calculations using the adjusted monthly closing share prices of securities To illustrate the advantage of the adaptive allocation strategy and the effect of withdrawal rates on the evolution of the capital, we give in Table 4 the results of simulations for the following withdrawal rates: 0%, 5%, 10%, and 15%. Table 4. Adaptive Portfolios with various annual withdrawal rates 2005-2014 Withdrawal rate % Total increase% CAGR% MaxDD% 0 714.50 23.33 -11.57 5 506.07 19.74 -14.08 10 297.64 14.80 -19.05 15 89.21 6.58 -30.72 The time evolution of the equity in the portfolios is shown in Figure 4. (click to enlarge) Figure 4. Equities of momentum-based portfolios with various annual withdrawal rates Source: This chart is based on Excel calculations using the adjusted monthly closing share prices of securities Conclusion The set of four mutual funds, selected for this study, perform exceptionally well for all three strategies and generate high returns at relatively low drawdowns. Between 2005 and 2015, the fixed target allocation with rebalancing was able to sustain withdrawal rates of up to 10% annually. The adaptive allocation algorithm was able to sustain withdrawal rates up to 15% annually without any decrease of capital. Disclosure: The author has no positions in any stocks mentioned, and no plans to initiate any positions within the next 72 hours. (More…) The author wrote this article themselves, and it expresses their own opinions. The author is not receiving compensation for it (other than from Seeking Alpha). The author has no business relationship with any company whose stock is mentioned in this article. Additional disclosure: This article is the third in a sequence on investing in mutual funds for retirement accounts. To help the reader compare the past performance of various mutual fund families, I selected a benchmark 10-year time interval starting on 1 January 2005 and ending on 31 December 2014. The article was written for educational purposes and should not be considered as specific investment advice.