Tag Archives: alternative

Greek ETF Faces Volatility On ECB Move

After last month’s political instability, Greece received yet another blow from the European Central Bank (ECB). The ECB on Wednesday announced that it would no longer accept Greek government debt as collateral for regular central bank loans, cutting off access to a key source of funding for Greek banks. This is likely to put fresh pressure on the country’s new government to rewrite the terms of its €240 billion bailout from the troika of the European Central Bank, the International Monetary Fund (NYSE: IMF ) and the European Commission (EU). Greek bonds are presently junk rated and are thus below the ECB’s minimum threshold to qualify as collateral. The recent move by the ECB means that the Greek central bank will now have to provide its banks with Emergency Liquidity Assistance (NYSE: ELA ), putting Greek banks in a tight corner as these are already facing signs of capital flight. The banks had earlier used their holdings of Greek government bonds to borrow from the central bank at an interest rate of just 0.05%. However, Greek banks will still have access to funds through the ECB’s emergency lending program, though the loans will carry a higher interest rate. However, the credit risk of the loans stays on the books of the Greek central bank. The move by ECB is significant as it sends a clear signal to Greece’s new Prime Minister Alexis Tsipras that the lenders are determined to force Greece to reach a compromise about any new potential debt terms. Moreover, it implies that if the Greek central bank is unable to solve its funding issues, the nation’s cash strapped government would have to step in for rescue. Market Impact The recent move by the ECB to tighten the country’s banking system made investors nervous, who then dumped Greek shares. Investors feared that ECB’s latest announcement might lead Greece to exit from the Euro zone. The Greek stock market shed more than 9% in early trading on Thursday following ECB’s move. Moreover, the Global X FTSE Greece ETF (NYSEARCA: GREK ), which tracks the performance of Greek stocks, plunged more than 10% on Wednesday following ECB’s announcement. Though GREK managed to recover part of its losses on Thursday and gained 4.4%, investors should cautiously trade the product. Below we have highlighted some of the details about the product. GREK in Focus The product tracks the FTSE/ATHEX Custom Capped Index and is home to a basket of 22 stocks. The fund manages a small asset base of $150.7 million and trades in solid volumes of 560,000 shares per day. The product holds a small basket of 24 stocks and is heavily concentrated in the top five holdings that make up for a combined 43.4% of assets. Financials takes the top spot at 32.5% in terms of sector holdings, followed by consumer discretionary (14.4%), consumer staples (13.4%) and materials (9.8%). The fund charges a fee of 65 basis points on an annual basis. The fund is down 7.3% in the year-to-date frame and currently has a Zacks Rank #3 or Hold rating.
Don’t Discount Bill Ackman

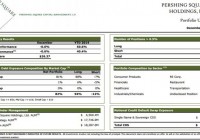
Originally Published on January 28, 2015 Bill Ackman wears an almost punchably smug expression. He looks as if he thinks that he is the smartest guy in any room. All the more grating is the fact that, in most rooms, he is right. He has reasons to be smug, having just came off of his best year ever, returning over 40% to his investors. Anyone can invest alongside him via Pershing Square Holdings (PSH). It costs $24.26 as of this writing which is over an 8% discount to its NAV per share of $26.43. Here are additional details from last month (including a slightly more dated NAV): (click to enlarge) Top positions include Allergan (NYSE: AGN ), Air Products (NYSE: APD ), Canadian Pacific (NYSE: CP ), Restaurant Brands International (NYSE: QSR ), Platform Specialty (NYSE: PAH ), Howard Hughes (NYSE: HHC ), and Zoetis (NYSE: ZTS ). Do such investments as managed by Ackman deserve a substantial discount? Evidence suggests that they do not. Ackman’s largest position, AGN, has been a spectacular success. That outcome is due to Ackman’s efforts to get it sold to Valeant (NYSE: VRX ). Pershing/VRX’s joint efforts led Actavis (NYSE: ACT ) to sign a definitive merger agreement with AGN. Ackman’s cost basis is about $129 per share on purchases that began in February of last year. He has made about $2.7 billion on this investment thus far. While much of this opportunity has already been captured there is still a double digit annualized net return on the spread between the AGN market price and the deal’s consideration. Target / Acquirer Tickers Parity Spread Return Allergan / Actavis AGN / ACT $230.09 $7.74 13% It appears that everything Ackman did with regards to AGN was perfectly legal. While AGN claimed that he violated securities laws, such a claim was a corporate defense designed to fend off an unsolicited bid. In 2014, Ackman successfully fended off insider trading accusations in court, entrenched management in a takeover battle, and the capital markets with spectacular outperformance. While we are endlessly reminded that past performance does not guarantee future results, it is a good indication that Pershing Square deserves a premium instead of a discount. What are PSH’s competitors in the world of conveniently available access to top hedge fund managers? Two are reinsurers, David Einhorn’s Greenlight Capital Re (NASDAQ: GLRE ) and Dan Loeb’s Third Point Re (NYSE: TPRE ). GLRE trades at a premium of almost nine percent and TPRE trades at a premium of almost four percent. If PSH trades up to an average of these two premiums, it would constitute a gain of over 16% from today’s price. While it is likely that all three fund managers would strenuously object to this characterization, they are peers of one another and have earned similar premiums. But more than anyone else, Ackman makes his own luck. You can share in that good luck by buying PSH. Disclosure: The author is long AGN, QSR. Additional disclosure: Chris DeMuth Jr is a portfolio manager at Rangeley Capital. Rangeley invests with a margin of safety by buying securities at deep discounts to their intrinsic value and unlocking that value through corporate events. In order to maximize total returns for our investors, we reserve the right to make investment decisions regarding any security without further notification except where such notification is required by law.

USO: Don’t Be Fooled By Minor Corrections

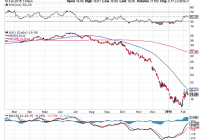
Summary After months of straight declines, oil prices seemed to bounce back starting in February. An increase in the RSI, though encouraging, is still not indicative of a broader correction. The 50-day moving average seems to be a resistance line. Oil production is still increasing. Since topping around June, oil prices have been in a steady and precipitous decline. Though the reasons have been speculated upon (mainly the debate is whether this is caused by low demand or high inventory), what is more important for speculators in the oil market is where prices are going. Around the beginning of February, prices have reversed their long and persistent decline by finally showing a rally. While this gives hope to many investors, especially those who bought oil companies hoping for a quick recovery, there are signs that there is still more pain to come. RSI and Technical Expectations (click to enlarge) To follow oil prices and technical indicators, I have shown a chart of the United States Oil Fund (NYSEARCA: USO ). A clear downtrend is apparent starting in June and continuing all the way to January. Since last month, the decline slowed noticeably, and starting in February, there is a decent correction forming. While the recent price increase is a case for optimism, a closer analysis reveals that the bear market may not be hibernating quite yet. Firstly, in bear markets, RSI tends to oscillate between 10 and 60. RSI is currently at around 50, and for real hope that this market is over, a value over 60 has to be there. Secondly, the most recent prices are showing that the 50-day moving average is unable to be surpassed, as USO hit that value, but then retraced after touching it. That said, a breakout is still possible, but with RSI hitting a wall below 60 and the price retracing at the 50-day moving average, the bear market is still well in place. Minor corrections are a part of bear markets, and this minor correction seems like exactly that, not a breakout. Fundamental Expectations The biggest factor that analysts are looking at right now is oil production. Once production finally decreases, we may then finally see the price of oil increase. While rig count can give a clue about production, it is not itself production, and production can still increase while rig counts are falling. Thus, the recent analysis by Citigroup ought to be concerning for any oil investors. It recently stated that: Despite global declines in spending that have driven up oil prices in recent weeks, oil production in the U.S. is still rising, wrote Edward Morse, Citigroup’s global head of commodity research. Brazil and Russia are pumping oil at record levels, and Saudi Arabia, Iraq and Iran have been fighting to maintain their market share by cutting prices to Asia. The market is oversupplied, and storage tanks are topping out. The same article noted that prices could fall as low as $20 per barrel. Clearly, these analysts are not buying this recent correction, nor should you. The low prices are here, and they are not going anywhere quite yet. Should We Trust Citigroup’s Analysis The question then becomes whether Citigroup is offering valid analysis, or is simply trying to change market sentiment to its benefit. To answer this question, I looked at the U.S. Field Production of Crude Oil offered by the EIA. (click to enlarge) The large increase in production since 2010 is obvious. The question now is whether US producers have taken steps to cut production now that oil prices have fallen so dramatically. To this end, a graph of year-over-year changes in production is shown. (click to enlarge) Clearly up to the latest data taken, no slowdown is found. In fact, not even a loss of momentum is apparently present. Production is increasing as quickly as it ever has, and based on this data, production is still not declining. December and January may show changes, but clearly the oil industry has a long way to go if production is going to be significantly cut in response to oil prices. Summary and Action to Take Oil is definitely not for the faint of heart right now. While I am uncertain about whether prices will actually fall to $20, I am fairly confident that oil prices are not poised for a sustainable rise quite yet. I would stick clear of USO for now, though outright shorting seems like an excessively risky move. Conversely, now would be a great time to load up on oil companies that are well poised to weather this low price environment. The way I would do this is with companies that have low debt and a good coverage ratio on their dividend. Helmerich & Payne (NYSE: HP ) is a great way to play a future correction, as it has very low debt and a current yield above 4%. There are other great companies to play the correction, though even staying put would be apt until we see further evidence that prices should rise. I would wait until production starts to decrease before investing in USO. Disclosure: The author is long HP. (More…) The author wrote this article themselves, and it expresses their own opinions. The author is not receiving compensation for it (other than from Seeking Alpha). The author has no business relationship with any company whose stock is mentioned in this article.