Tag Archives: alternative

To Hedge Or Not To Hedge?
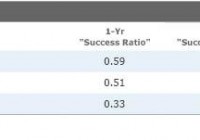
This is an updated version of an ETF Specialist originally published on Feb. 19, 2014. Currency-hedged exchange-traded funds have come into vogue of late in the United States. Investor interest was first piqued by the performance of the oldest and largest of them all: WisdomTree Japan Hedged Equity (NYSEARCA: DXJ ) . The fund owns a portfolio of dividend-paying Japanese stocks that generate more than 80% of their revenue outside of Japan. It gained nearly 42% in 2013, as a massive dose of monetary stimulus contributed to an 18% decline in the value of the Japanese yen, and steady improvement in the global economy gave Japan’s stock market an additional boost. In contrast, iShares MSCI Japan ETF (NYSEARCA: EWJ ) , which tracks a standard market-cap-weighted benchmark and does not hedge its yen exposure, increased by 26% in 2013. Clearly, it paid for U.S. investors in Japanese stocks to have a hedge against a declining yen over this span. But was this a flash in the pan, or do currency hedges have value over longer time frames? With the U.S. dollar marching steadily higher–thanks in part to (relatively) attractive interest rates–and double-digit moves in major currencies making headlines, now is a good time for investors to explore these questions. Back to Basics: Return, Risk, and the Practicalities of Putting a Currency Hedge in Place In simple terms, a domestic investor’s local-currency-denominated return in a foreign security (or a portfolio of them) is equal to the foreign security’s (or portfolio’s) return plus the foreign currency return, plus the product of the foreign security return and the foreign currency return. The last part of this equation accounts for the interplay between the two, and as it is the product of these two figures, its contribution to the overall return will grow as either the foreign asset return or the foreign security return grows larger. Domestic Currency Return = Foreign Security Return + Foreign Currency Return + (Foreign Security Return x Foreign Currency Return) The effect of fluctuating exchange rates can either help or hurt returns. In the case of U.S. investors holding Japanese stocks, the yen’s depreciation hurt the U.S. dollar return for unhedged investors in 2013, as evidenced in part by the iShares fund’s relative underperformance versus the WisdomTree offering. In another extreme example, the 34% appreciation of the Brazilian real contributed to the 124% calendar-year return posted by iShares MSCI Brazil Capped ETF (NYSEARCA: EWZ ) in 2009. These examples highlight that currency effects can be extreme in magnitude. It’s also important to consider currencies’ effect on the risk of a portfolio of foreign securities: The expression for the variance (the square root of which is the standard deviation) of a foreign security or portfolio’s returns is as follows: σ 2 $ = σ 2 LC + σ 2 S + 2σ LC σ S ρ LC,S, where σ 2 $ = the variance of the foreign asset returns in U.S. dollar terms; σ 2 LC = the variance of the foreign asset in local-currency terms; σ LC = the standard deviation of the foreign asset in local-currency terms; 2 S = the variance of the foreign currency; σ s = the standard deviation of the foreign currency; ρ LC,S = the correlation between the returns of the foreign asset in local-currency terms and movements in the foreign currency. This expression demonstrates that the volatility of a foreign asset in domestic-currency terms is directly related to the volatility of the asset in local-currency terms (the first term in the expression) and the volatility of the foreign currency (the second term). It also shows that the higher the correlation between the foreign asset in local-currency terms and movements in the foreign currency, the greater the variance will be in local currency terms. (Again, take the square root and you’ll get the standard deviation.) Hedging away currency exposure will reduce risk, as measured by standard deviation–as can be seen in Exhibit 3 below. How does currency hedging work in practice? Most currency-hedged ETFs will use currency forward contracts to reduce their foreign-currency exposure. A currency forward contract is an agreement between two parties to buy or sell a prespecified amount of a currency at some point in the future (typically one month out in the case of currency-hedged ETFs) at an exchange rate agreed upon between the two parties. Because the value of the forward contract is fixed ahead of time, and the value of the fund will fluctuate during the course of a month as asset prices and cash flows into and out of the fund fluctuate, the forward may not be a perfect hedge. It’s also important to note that these hedges come at a cost, though their price tag typically amounts to just a few basis points in the case of developed-markets currencies in stable interest-rate environments. FX Effects It is useful to look at historical data to frame the effects of currency hedging on investment performance (for U.S. investors in this case). There are two key elements to consider when assessing the effects of currencies on equity portfolios: their contribution to return (as covered above) and their contribution to risk. Exhibit 1 shows “success ratios” for a trio of MSCI benchmarks over the 20-year period ended Jan. 31, 2015. These benchmarks are all tracked by one or more currency-hedged (and unhedged) ETFs. The success ratio represents the portion of the overlapping monthly rolling one-, three-, and five-year periods over these two decades during which the unhedged version of the index outperformed its fully hedged counterpart. For example, the MSCI EAFE Index outperformed its fully hedged counterpart in 59% of these overlapping rolling one-year periods over this 20-year span. In hindsight, in the case of the MSCI EAFE and MSCI Germany benchmarks, the winner could have been predicted by the flip of a (mostly) fair coin. The story is different when it comes to the MSCI Japan Index, where “getting the yen out” has clearly paid off more often than not. Exhibit 2 contains the annualized average returns for each benchmark across each of the overlapping monthly rolling one-, three-, and five-year periods dating back 20 years from the end of January 2015. The differences in relative performance vary between the hedged and unhedged versions of these indexes depending on the length of the measurement period. The MSCI Japan Index is again a unique case, as evidenced by the yawning performance differential between its hedged and unhedged versions. What about risk? Currency risk is a significant contributor to overall risk in the context of a foreign-equity portfolio. Exhibit 3 shows the trailing 20-year annualized standard deviations and Sharpe ratios for the same benchmarks featured in the first two exhibits. In the case of all three benchmarks, it is clear–as evidenced by the difference in Sharpe ratios between the U.S. dollar and hedged versions of the indexes–that currency exposure is a meaningful source of risk, currency hedging can serve to mitigate this risk, and it may ultimately result in superior risk-adjusted performance. To Hedge or Not to Hedge? The best answer to the question of whether it makes sense to hedge the currency exposure of an international-stock portfolio is this: It depends. By hedging foreign-currency exposure, investors can mitigate a source of risk–but at the expense of a potential source of return. The trade-off between the two is important, and investors’ decisions will depend on a variety of factors, including but not limited to their return requirements, risk tolerance, investment horizon, and the costs associated with hedging currency exposure. Disclosure: Morningstar, Inc. licenses its indexes to institutions for a variety of reasons, including the creation of investment products and the benchmarking of existing products. When licensing indexes for the creation or benchmarking of investment products, Morningstar receives fees that are mainly based on fund assets under management. As of Sept. 30, 2012, AlphaPro Management, BlackRock Asset Management, First Asset, First Trust, Invesco, Merrill Lynch, Northern Trust, Nuveen, and Van Eck license one or more Morningstar indexes for this purpose. These investment products are not sponsored, issued, marketed, or sold by Morningstar. Morningstar does not make any representation regarding the advisability of investing in any investment product based on or benchmarked against a Morningstar index.
Are Some Decisions To Allocate To U.S. Equities Due To Survivorship Bias?

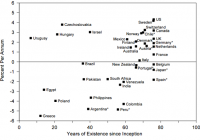
By David Foulke The CFA Institute Magazine recently published an interview (a copy is here ) with C. Thomas Howard, CEO of Athena Investment Services. Howard has some pretty explicit views on why investors should allocate all of their assets to U.S. stocks: The primary driver of long-horizon wealth is expected returns. Why would you invest in anything but stocks? Why isn’t your portfolio 100% stocks? Do you believe stocks are going to have the highest return? By the way, stocks have averaged 10% a year for a long period of time. Bonds have averaged about 6%. The difference between a portfolio that’s 100% stocks and one that is a mixture of stocks and one that is a mixture of stocks and bonds over long periods of time is huge, possibly millions of dollars. Why would I want to buy anything but the highest expected return, asset-wise? U.S. stocks have offered the best returns for a long time, and therefore the U.S. stock market is where you want to be invested. This is an interesting argument. Certainly, Howard is right that the U.S. stock market has been the best place to be invested. For instance, Mehra and Prescott in their 1985 paper, “The Equity Premium Puzzle” (a copy can be found here ), demonstrated how the risk premium on U.S. Equities from 1889-1978 averaged roughly 6%. The paper was notable in that it suggested that existing general equilibrium models were unable to explain the size of this premium, which was dramatically higher than for other economies. Academics struggled to explain the persistently strong U.S. stock market. This is the “puzzle” to which the paper’s title refers. In 1998, Reitz proposed that investors in U.S. markets might be more risk averse due to the potential occurrence of large drawdowns, or “crashes.” In a risky market that could crash dramatically, risk averse investors might expect high equity returns as compensation for bearing the risk of such crashes. Perhaps this explained high returns in the U.S. As academics pondered the effect of possible crashes on risk premia, they increasingly questioned that it was risk aversion to crashes that was driving returns. Some thought these unexplainable returns might have something to do with whether a market simply survived, which by definition meant that it consistently recovered from periodic drawdowns over long time frames. Was their some bias introduced to a market’s returns that was associated with the mere fact of its survival? In their paper, “Global Stock Markets in the Twentieth Century” (a copy can be found here ), the authors Jorion and Goetzmann explored this question. They examined 39 global stock markets from 1921 through 1996 and, as before, saw evidence of the outperformance of the U.S. stock market, which provided a real return of 4.32% over the period, the highest of all countries. During this period, however, several of these 39 markets experienced interruptions to their functioning, caused by forces such as war, political instability, hyperinflation, and so forth. The authors compared what happened when they considered both “loser” markets, and how long they were viable, in addition to the survivors, like the U.S. and others, who were “winners” over long periods. The figure below plots annual returns against the length of the history of each market: (click to enlarge) There appears to be a clear relationship between returns and longevity of markets, with longer-lived markets generating higher returns. Over the period, the median return for all 39 countries was 0.75%, representing the return earned by holding a globally diversified portfolio since 1921. Notably, there were 11 “winner” countries, which had continuous returns going back to 1921. For this group, the median return was dramatically higher, at 2.35%. Also, note that the U.S. appears at the upper right of the figure. These results suggest that returns for the U.S. 1) are uncommon at 4.3% versus 0.8% for all other countries, and 2) could be explained by survival, as could higher returns for the other survivors. If you happened to invest in a country that survived, you would have earned higher returns. The paper also examined Reitz’s hypothesis. Recall that Reitz had suggested that investors demanded a higher return as compensation for the risk of a crash. If this were true, then you would expect to see the “losers” exhibit higher equity premia. As the figure above illustrates, the opposite appears to be the case. A regression of these points would slope upward to the right. The returns of the winners may thus be conditional on their survival. If you think about investing in a particular country as like drawing a ball from an urn, then how meaningful is it to say that we can expect future returns to resemble past returns in that country, if those past returns are a result of survivor bias? Survivor bias refers to how we can focus on survivors in a data set, and ignore failures, which provide additional information about risk. Hindsight may be 20/20, but predicting the future is not, and if we condition on only the surviving winners, we ignore the possibility that we may be investing in a previous winner that may turn into a loser in the future. In a PBS interview (a copy is here ) Jack Bogle stated the following: Good markets turn to bad markets, bad markets turn to good markets. So the system is almost rigged against human psychology that says if something has done well in the past, it will do well in the future. That is not true. And it’s categorically false. And the high likelihood is when you get to somebody at his peak, he’s about to go down to the valley. The last shall be first and the first shall be last. Indeed, why should it be easy to predict which markets will survive? As Bogle points out, it may be precisely the past winners who are about to fail. Or as Jeremy Siegel stated in his paper, “The Equity Premium: Stock and Bond Returns since 1802”: Certainly investors in…1872…did not universally expect the United States to become the greatest economic power in the next century. This was not the case in many other countries. What if one had owned stock in Japanese or German firms before World War II? Or consider Argentina, which, at the turn of the century, was one of the great economic powers. It’s probably likely that Argentinian investors predicted continued economic dominance at the turn of the century. They were wrong. The outcome of World War II, which today looks obvious, could have played out in many different ways, and the U.S. might very well have turned into a loser. The Japanese certainly thought they would emerge as the dominant power after the war, or they wouldn’t have fought the war. Same for Germany. If the outcome of WW II had been different, we might today be studying the stock markets of Japan, Germany or other European countries, instead of the U.S. Who is to say the U.S. will not enter a hyperinflationary period or a sustained major war? Such an outcome for the U.S. is obviously not without precedent elsewhere. When we look at past U.S. returns, we are looking at a market that did not fail, but does it follow that it cannot fail in the future? Conditioning on past survival can subject investors to risks, which they are not accounting for. Even with strong past returns, we need to consider survivor bias, and that we are necessarily betting on a winner. Interestingly enough, Warren Buffett and Jack Bogle offer investors puzzling investment advice in the face of the results presented by Jorion and Goetzmann and a simple knowledge of survivor bias. First, Warren’s advice: Put 10% of the cash in short-term government bonds and 90% in a very low-cost S&P 500 index fund. (I suggest Vanguard’s.) Next, Jack Bogle’s advice : I wouldn’t invest outside the U.S. If someone wants to invest 20 percent or less of their portfolio outside the U.S., that’s fine. I wouldn’t do it, but if you want to, that’s fine. We have to question whether the advice from Buffett/Bogle considers the reality of survivor bias or their own personal bias. Original Post

Is There A Holy Grail To Investment Success?

It is possible to beat the market averages, otherwise managers like Warren Buffett and George Soros would not have done so consistently for many years. Investors should maximize the geometric mean of their outcomes instead of the arithmetic mean. Leverage destroys the geometric mean of returns over time, which is why it should never be used. The efficient market hypothesis only applies to equity exclusive investors and equity fund managers. Investors who manage concentrated stock portfolios and multiple asset classes can beat the averages. As Dr. Edward Thorp discovered the secret to beating the game of blackjack, investors can use probability to beat the stock market by skewing the odds in their favor. The Holy Grail is described in mythology as the cup that Christ drank from during the Last Supper, and is described as having mystical and miraculous powers. It is the stuff of medieval and Arthurian legend. It is also metaphorically described as something magical and elusive that may or may not exist. For investment professionals, the Holy Grail would be a formula for trading the financial markets that generates superior results. But to determine whether the Holy Grail exists or not we first have to define our terms. What results would classify a trading or investment formula as the Holy Grail? Would it be a strategy that simply beats the stock market averages or beats it by a lot? Some theorists believe there is no investment Holy Grail, just as some believe there is no secret to financial success. But throughout human history there have always been people who succeeded financially and those who did not. Is there a key that separates the successful from the unsuccessful? There must be otherwise it would not be happening, the same way it has happened for thousands of years. The proponents of the Efficient Market Hypothesis (EMH) and Modern Portfolio Theory (MPT) would have you believe that it is not possible to beat the market averages and that everyone should just buy an index fund and be done with it. But if that were true there wouldn’t be managers such as Warren Buffett and George Soros and numerous others who have beaten the averages consistently for many years. If the odds were against them, then they would have lost money or their results would have mirrored the averages. It is obvious they are doing something different from the norm. The question is, what is it? Proponents of EMH argue the averages cannot be bested because they take the performance results of the equity mutual fund industry as a whole and compare it to the market averages. The problem with this reasoning is they fail to make the connection that equity mutual funds as a whole are the market. Of course, their results will not significantly differ from the averages. That is like saying someone who bets on every horse in a race cannot lose. Of course they can’t. After years of experience and extensive research, I’ve come to the conclusion that the Efficient Market Hypothesis, while valid, only applies to equity exclusive investors with broadly diversified stock portfolios. In other words, it applies to individual investors who only buy stocks, as well as equity fund managers. For example, if you are a stock fund manager with a required minimum of 100 stocks in your portfolio, then you will be at a disadvantage. Over time, your results will not significantly differ from the averages, and transaction costs will leave your results below that of the averages. Mathematically speaking, there are two ways to beat the stock market averages: Have a concentrated equity portfolio Own multiple asset classes Leveraging a portfolio will not beat the market averages, as I will explain later. For example, let’s say we have a DeLorean and went back in time to the year 1990. For argument’s sake, let’s say you wanted to invest in equities, but could only buy 5 stocks. You decided to buy Microsoft (NASDAQ: MSFT ), Intel (NASDAQ: INTC ), Apple (NASDAQ: AAPL ), Starbucks (NASDAQ: SBUX ), and Wal-Mart (NYSE: WMT ). How would your portfolio have fared? We all know the answer to that. A portfolio of these winners would have left the market averages in the dust. Of course, hindsight is always 20/20, but this example demonstrates the power of a concentrated portfolio with superior performers. The trouble is, no one could have predicted that result let alone had the wherewithal to stay with those positions. The other way to beat the averages is to own multiple asset classes. Different asset classes, such as bonds, precious metals, real estate, and cash, can not only reduce the overall risk of your portfolio, but also make it more profitable. By holding different asset classes and rebalancing them regularly, investors will be profiting from market fluctuations. This differs from the margin speculator who is betting on the direction of the market. He will always lose in the long run to the balanced investor. The purely mathematical reason for this is because big losses hurt you more than big gains help you. Let’s say you start with $1000 and enter an investment that combines a 9 percent gain with a 9 percent loss. You would end up with $992. In contrast, let’s say a speculator entered the same position, but instead used 10 times the leverage. He would end up with $190 at the end. Roughly an 80 percent net loss! This is astonishing when you think about it, especially given the number of traders out there who are holding naked margin positions. When you ask most speculators about the potential risks of their trading systems, they think simplistically that a 90 percent gain combined with a 90 percent loss will be a wash with no net gain. This is incorrect because they aren’t grasping the concept of the arithmetic versus the geometric mean. With the arithmetic mean or simple average, you add up all the outcomes and divide by the number of outcomes. Whereas, the geometric mean multiplies the outcomes and takes the root of the number of outcomes. For example, let’s take 3 numbers: 1, 7, and 13. The arithmetic mean or simple average would be 7, whereas the geometric mean would be 4.5. (1 + 7 + 13) / 3 = 7 Simple Average ³√ (1 * 7 * 13) = 4.5 Geometric Average The geometric mean is calculated by multiplying the three numbers and taking the cube root of the product. Compound return is geometric average, not simple average. Leverage always lowers the geometric mean of outcomes over time because once again, big losses hurt you more than big gains help you. Every consistently winning manager emphasizes and follows this rule. Large losses destroy a portfolio, and reducing or eliminating leverage is the first step to increasing absolute return. Investors should always choose the game with the highest geometric mean of returns. This is the Holy Grail. However, if you define the Holy Grail as an investment system with all gains and zero losses, not even in the short term, then I would agree there is no Holy Grail. But a system that significantly beats the market averages over time could be classified as such. In 1962, a mathematician by the name of Edward O. Thorp published the book, Beat The Dealer, which presented the first popular mathematical system for beating the game of blackjack. The card counter was born. Contrary to popular opinion, the card counter was not immune to losses. He could lose half his bankroll during a losing streak. But if the counter kept playing, he would beat the casino significantly. It was just a matter of time. The odds were on his side. Dr. Thorp discovered the Holy Grail of beating the game of blackjack. It was a probability puzzle and he figured out how to skew the odds in his favor. The financial markets are nothing more than one giant probability puzzle. If others have beaten it, it is entirely possible that you can too. Disclosure: The author has no positions in any stocks mentioned, and no plans to initiate any positions within the next 72 hours. (More…) The author wrote this article themselves, and it expresses their own opinions. The author is not receiving compensation for it. The author has no business relationship with any company whose stock is mentioned in this article.