Tag Archives: alternative

NextEra Energy, Part 1 – This Utility Leader’s Upside Might Be Limited
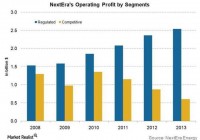
Summary NextEra’s Hawaii deal is truly a place of growth, but it may be priced in for now. NextEra’s economic moat creates true long-term value to dividend players. NextEra looks unlikely to increase dividend significantly with recent investments and limited FCF or cash on hand. NextEra (NYSE: NEE ) is coming off a very strong 2014 in which the company was able to see a return of 20%. Utilities were very strong. The company’s valuation increased to a nearly 19 P/E. The question, now, is whether this utility giant is still a buy or should investors wait for a pullback. 2015 looks like an interesting year for the company with the development of their operations in Hawaii, continued economic moat strength that is reliable during volatile times, and some moves the company is making in the green arena that we believe has interesting potential. This is Part 1 of a two-part article we are doing on NextEra for our assessment of the company as a socially responsible investment. The first part of all of our work is a traditional analysis of the company as an investment. Do we believe that “X” company has upside in the current environment? From there, we add a lens of socially responsible analysis to understand if the company also presents compelling factors for social responsibility. If both line up, it becomes a great SRI. In this article, we are examining NextEra in terms of traditional financial analysis. In Part 2 , we will examine the secondary factors of socially responsible investing. 2015 Catalysts Economic Moat Strength To us, the most important catalyst for NextEra remains their economic moat strength. Utility companies, as a whole, maintain very strong economic moats due to their non-competitive arrangements with municipalities. These arrangements allow the company to remain very consistent profits, and the more non-competitive arrangements…the better for these companies. These moats are extremely important. For example, the company had 80% of its business in the regulated, and regulated utilities profits continue to increase while competitive utilities stay stagnant. See this image from Market Realist: (click to enlarge) The company continues to see regulated profits growing while competitive profits have been flat to weak. The company has seen lower prices in competitive areas due to wholesale a wider mix of energy that is less profitable. Yet, the company’s 80% regulated market is a huge win for the company. It creates a great economic moat that other companies just do not have, and it is something investors can rely on. The company maintains one of the highest margins in the industry with this strong mix, and there is little threat to a major push down. For those looking for consistency, NEE is definitely a leader. This theory of strong profit, regulated business is why we are excited about the company’s foray into Hawaii. Hawaii – Another Regulated Market to Add Shareholder Value The Hawaiian market has a new entry from NextEra after the company bought Hawaiian Electric (NYSE: HE ) for $4.3B in 2H of 2014. We believe that this move is key to 2015 and even beyond. What we think is the best aspect of this deal is the combination of regulated markets with the company’s penchant for bringing more efficient practices to bear. The company, in fact, will reduce customer costs. The expertise that NEE has in using combinations of energy, especially renewable, will be very beneficial for Hawaii. The state, today, pays greatly for importing oil and other electricity generators. NEE has plans to revolutionize the space with solar energy. The state is one of the best for solar energy, and the company can use their strength here to help the state as well as company revolutionize their grid. The deal is more than just solar, though. The company has already got a deal together with a giant wind farm that will be part of the company’s push to use Hawaii’s natural state to bring down costs: NextEra Energy Resources, a wholesale electricity supplier and subsidiary of NextEra Energy , which is buying Hawaiian Electric Co. for $4.3 billion, has locked in long-term access rights to Parker Ranch Foundation Trust lands to develop renewable energy projects. ‘We have been aggressively seeking ways to reduce the cost of electricity for our community and our island by using the potential renewable energy resources available on PRFT’s Hawaii Island lands,’ Neil ‘Dutch’ Kuyper , president and CEO of Parker Ranch, said in a statement. ‘During this time, we have also been seeking capital and technical expertise from potential development partners. We have been working collaboratively with NextEra Energy Resources for more than a year and believe that they are the ideal partner to utilize PRFT’s wind resources.’ What does that mean for NEE shareholders? The deal was announced on Dec. 4, and the stock has gone nowhere since. There was speculation obviously leading until the deal. Thus far, shareholders have rewarded the company very little for the deal. So, just how much value might this deal add. The deal is still going to take 2015 to get done, but that sets the company up for 2016. Further, they are already doing work at bringing this deal up to speed. It is a short-term capex bust, but we see large potential moving forward. According to Dana Blankenhorn , the state is still very dependent on coal and oil: On my own visit to the Big Island of Hawaii, now served by Hawaiian Electric, I marveled at the wealth of potential renewable resources – wind, solar, geothermal and tidal energy – and was amazed at how much people had to pay for their power. Since then the state has begun tapping into that potential , but 86% of its electricity still comes from coal and oil. The company brings the expertise of how to apply a mix of renewable energy and create consistent returns. With the prices that Hawaii is used to paying, the company should reduce costs for Hawaiians yet also make a strong profit. The company’s mix, though, of more green energy plays has not been as profitable. The company still makes its bread and butter in Florida where it uses a majority natural gas. So, the question will be if they can return the type of 20% operating margin in Hawaii? The nice thing that is baked into the cake for them is that Hawaiians are used to paying more than most Americans, so they will be able to invest more easily. How this plays out is the key theme to watch for the coming year. Current Pricing Let’s take a look at the current price of NextEra stock and understand what it means for the company. From there, we will examine the bull case for that price and the bear case. Finally, we will look at exactly where we believe the company is going. While you may see the article as negative, we presented the first portion of this article to establish how we will look at the current pricing. In order to price the company, we need to make certain assumptions. Revenue growth will continue at a clip of 4-5% per year, and we believe that level will maintain for the next several years. Utility revenue is fairly consistent. The key to the company is definitely margins. Operating margins are key to our DCF analysis. The coming has forecast that they will come in at the 22-23% in 2015, but I imagine this number will dip some with the onslaught of Hawaiian Electric when it is approved. The deal should add roughly $4.5B in sales in 2016, but the company operates with a 10% operating margin. The deal is really essentially to take what is a tough market for making money, revolutionize it, and improve it. This plan, though, will take several years. Therefore, margins will drop in 2016 but gradually improve again through 2020. Taxes have averaged roughly 25% for the past five years, and it’s likely this will stay around 28%-30% over the next several years. We may see it jump even a bit more beyond 2016 when more solar credits are expected to expire. Depreciation will continue to grow at about the same rate as revenue growth. Capex should come down in 2015 to around $6B and again in 2016 to $4B.The $4B rate, though, is pretty standard for the company. Our cap rate or discount rate is at 3%. This does not reflect the high-growth but rather the strong ROE, dividend, and low volatility the company will face over the next several. When we use this math in our five-year DCF analysis, we come up short at $82 for our share price. In order to reach the $100-plus level that the company is currently operating at, they would need to see revenue growth averaging 6% per year for the next five years and maintaining a 22% margin. Here is what that looks like: PROJECTIONS 1 2 3 4 5 2015 2016 2017 2018 2019 Income from Operations 3,740.000 3,700.000 5,148.000 5,456.000 5,784.000 Income Taxes 1,122.00 1,110.00 1,544.40 1,636.80 1,735.20 Net Op. Profit After Taxes 2,618 2,590 3,604 3,819 4,049 Plus: Depreciation 2600 2700 2800 2900 3000 Less: Capex -6000 -3900 -4000 -4250 -4500 Less: Increase in W/C -100 -100 -100 -100 -100 Available Cash Flow -682 1,490 2,504 2,569 2,649 The Bull Case The bull case is twofold. On one end, the company is a strong utility with consistent profits and a yield of nearly 3%. Further, the company provides a green edge that will continue to develop as both a reason to buy companies and a competitive advantage. The company’s margins are strong and consistent. Further, on the other side, the company has real opportunity with Hawaii. While it may detract in the near-term, if the company can do it right, it could end up bringing a strong revenue/profit burst. Yet, we believe that the current pricing on the company suggests that a best-case scenario is priced in. We understand you don’t buy utilities for value or growth. You buy them to hedge volatility, add consistent ROE/yields, and diversify by industry, and NEE is one of the leaders in the industry. The Bear Case Utilities have been very strong, and it appears that NEE is probably cooked about to perfection right now with its current pricing. The company is unlikely to make a major pullback, but near-term upside may be limited. We believe a price target around $90 is more fair level with an upper band at $105 to $110. The reason for this is that we can’t foresee more than 22% operating margins and 6% revenue growth with the HE deal on the docket. The company also is not flush with cash or FCF right now to really pour into share repurchases or add more to its dividend. Therefore, the value in the company is that it is consistent right now. Where We Come In We like NEE’s business model, but as value investors, the company seems priced correctly at this time. We would be interested if NEE came back in under $90. Yet, we also see the value of a true leader in the industry that continues small dividend increases and is making moves in natural gas and new territory that remain intriguing propositions. Conclusion NextEra has interesting catalysts to 2015, but after a tremendous run in 2014, the company looks like its upside may be limited in the near-term. The value of adding a deal like HE to the mix is definitely long-term, and we do like the consistent margins/yield/growth. The company has great economic moats, so it is a nice place to park cash, expect limited losses, and collect dividends. For value/growth investors, though, this play has lost its allure … for now. Disclosure: The author has no positions in any stocks mentioned, and no plans to initiate any positions within the next 72 hours. (More…) The author wrote this article themselves, and it expresses their own opinions. The author is not receiving compensation for it (other than from Seeking Alpha). The author has no business relationship with any company whose stock is mentioned in this article.
GURU And ALFA: Are Hedge Fund ETFs Worth Your While?

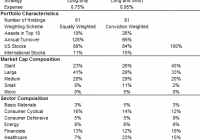
Summary There has been a great deal of interest in ‘hedge fund cloning’ ETFs of late. Despite exhibiting decent performance, a closer look reveals a different story. We remain skeptical of their alpha potential, after a detailed analysis of their track record. There has been significant interest in recent years in “cloning” the equity investment ideas of hedge funds, leading to the launch of several ETFs and indices that track their stock picks. In this article we provide an assessment of the two longest running ETFs, the Global X Guru Index ETF (NYSEARCA: GURU ) and the AlphaClone Alternative Alpha ETF (NYSEARCA: ALFA ). GURU and ALFA At a Glance Despite both being “copy-cat” funds, GURU and ALFA are actually two quite different propositions. Key Features From an investment strategy perspective, the GURU is designed to be 100% long, while the ALFA has the flexibility to go short by 50% subject to market technicals. In other words, one is a long-only equity fund, while the other aims to mimic long/short equity hedge funds by altering its market exposure over time. Due to its hedging ability, the ALFA appears to charge more for this feature, with the expense ratio close to 1%. Portfolio Characteristics A key difference between the two ETFs is their stock weighting methodology. GURU weights its positions equally, and has fewer positions in total. The ALFA applies variable weighting, with higher weights assigned to higher conviction names based on a proprietary scoring methodology. It is more concentrated than GURU in the top holdings, but has a long tail of smaller positions. It is difficult to say which method is more effective, only time will tell. Both portfolios comprise mainly of U.S. stocks, which is intuitive as hedge funds do not disclose their overseas holdings in 13F filings – unless they are U.S.-listed securities, such as ADRs. In terms of portfolio churn, both ETF portfolios have fairly high turnover ratios. For GURU, this is at a staggering 128%. We believe a high turnover is only justified if it results in superior performance, otherwise it typically cranks up excessive trading costs and impacts long-term returns. Portfolio Composition According to Morningstar classifications, both ETFs have a pronounced mid/small-cap bias, as evidenced by their high allocation to SMID cap stocks. The ALFA has a more aggressive tilt than the GURU. From a sector perspective, we would note the high allocation to the tech sector of both funds, although it is not too far from market index weights, as defined by the Russell 1000 Index. Performance Benchmark As both ETFs are essentially U.S. equity funds and exhibit a mid-cap orientation, we believe the Russell 1000 Index (“R1000”) is an appropriate performance yardstick. The Vanguard Russell 1000 ETF (NASDAQ: VONE ) tracks this benchmark and charges a 0.12% fee. Quantitative Analysis – Last 31 Months (1 Jul 2012 – 31 Jan 2015) Below is a summary table of key MPT statistics for the past 31 months, based on monthly data. Investment Results Both the GURU and ALFA have done well over the past 31 months (since common inception date), posting modest outperformance versus the Russell 1000 Index. Risk Both ETFs have exhibited higher volatility than the R1000 (as measured by the standard deviation). At ~11%, this is some 30% higher than the market index. From a beta perspective (sensitivity to equity market movements), both are also higher, at 1.20 and 1.08 respectively. Alpha Alpha is a measure of manager skill on a risk-adjusted basis, in other words it reconciles return and volatility to provide an indication of stocking picking skill. After accounting for volatility, the GURU’s alpha is negative, and the ALFA’s is mildly positive. GURU’s outperformance over the R1000 appears to have been achieved with higher risk. At 1.2 beta, it is akin to R1000 running on steroids, but less efficient. To illustrate this point, if we levered the R1000 to a similar level (beta of 1.2x), this would have yielded better returns at lower volatility. Tracking Error GURU and ALFA are both high tracking error products, meaning their performance pattern can diverge significantly from the R1000 from time to time (both positive and negative) — and benchmark-aware investors should be prepared to stomach this performance divergence. Risk Adjusted Returns Both ETFs have posted identical and good risk-adjusted returns in terms of Sharpe Ratio. However, the slightly levered R1000 once again leaves both ETFs in the dust. Taking It All Together Despite outperforming the R1000 Index in the past 31 months, the alpha of these ETFs are not significant (and negative for GURU), after taking into account their volatility. A Longer Term Perspective For better understanding of the performance pattern of these ETFs, we can look at the indices that they track, which has been back-tested over longer periods. However, one must note that these are “back-tests” and must be treated with a degree of caution. After all, a back-tested index must demonstrate favorable results before a ETF provider is willing to wrap it into an investment product. We do not know how conservative the index producers have been with their assumptions, so we will look no further back than the past 60 months (or five years). 60 Month Statistics (1 Feb 2010 – 31 Jan 2015) The longer term stats paint a similar picture. Guru Index Alpha is again negative over the past five years. Its higher return is explained by higher beta. A similar version (1.1x) of the R1000 would have achieved higher returns at lower levels of volatility. AlphaClone Index Alpha is high at 4.6. This number is a result of a) lower volatility than the R1000 and b) similar level of return. Its 60-month beta is 0.66, a third of the market index. This implies that its market hedge mechanism must have kicked in during this 60 month period, which has provided some protection in down months of the R1000. Despite the existence of alpha, we would note the following: In the period since the ALFA ETF has been live, hedging has not been used, as indicated by its beta of 1.1 to the R1000. It would be interesting to see how it works in practice in the future. In absolute return terms, the back-tested performance of ALFA over the past 60 months is still inferior to the R1000 (15.2 vs. 15.8). A skillful equity long/short hedge fund manager would typically be able to capture less downside, but a similar level of upside, resulting in better returns than the market index over time. This indicates that AlphaClone’s market hedge (think of it as the manager’s skill in shorting the market) have not helped drive extra returns over this 60 month period. A Closer Look at Alpha Patterns We believe outperformance from stock selection comes in waves, and is not constant. There will be extended periods when a portfolio performs well, and extended periods less well due to the existence of style biases (i.e. growth, value, size effect etc). These biases can be in, or out of favor with the market from time to time. To assess alpha patterns we look at the rolling 2-year excess returns versus the R1000. Our assessment period is the last 60 months, as above. Interestingly, the Guru Index has been losing altitude of late, with its margin of outperformance vs. the R1000 dropping fast. This points to a deterioration in its stock selection — possibly due to style biases, a decline in the performance of hedge funds they track, the efficacy of their cloning process, or a combination. Meanwhile, the AlphaClone Index has lagged the R1000 for years (on a rolling 2 year basis), before taking a positive turn in late 2013. This is most likely because the index has very much been long-only and not market hedged since then. Tracking Quality One final factor to consider is the quality of index replication. The good news is that both ETFs appeared to have tracked their underlying indices well after fees in real life. The tracking error is marginally higher for the GURU in the past two calendar years, despite having a lower fee than the ALFA. Our Verdict Over the past 31 months, the GURU and ALFA ETFs have performed well in absolute terms, although if one takes a closer look, reveals a different story. For GURU, we are concerned of its high beta, high portfolio turnover, and stock selection efficacy which has been decreasing recently. For ALFA, we are not big fans of its higher fees and market hedge, which has not been tested in real life. As long-term equity investors interested in maximum capital appreciation, we do not believe that market timing adds value. This is confirmed by the ALFA’s subpar returns to the R1000 over the period under review. Based on our analysis, we remain skeptical of both ETFs’ alpha potential. Disclosure: The author has no positions in any stocks mentioned, and no plans to initiate any positions within the next 72 hours. (More…) The author wrote this article themselves, and it expresses their own opinions. The author is not receiving compensation for it (other than from Seeking Alpha). The author has no business relationship with any company whose stock is mentioned in this article. Additional disclosure: For research purposes, Real Return Partners LLP compile the RR Partners AlphaEquity® Index (Bloomberg: RRALPHA). This is a long-only equity index that tracks the performance of a portfolio of 20 US-listed, 13F equity positions representing the best ideas of an elite group of institutional money managers. The Index is independently calculated and is published as a net total return index. There are no investment products linked to this index.

Will The FOMC Bring Back Up GLD?

Summary The minutes of the last FOMC meeting were released. The minutes could indicate that the FOMC members have concerns that could postpone the next rate, which could bring back up GLD. The uncertainty in Europe around the Greek debt problem could play in favor of GLD. Since the beginning of the month, shares of the SPDR Gold Trust ETF (NYSEARCA: GLD ) fell by 5.8%. But the recent release of the minutes of the last FOMC meeting and the latest developments in Europe could provide some backwind for the gold ETF. The FOMC minutes revealed that its members wanted to reiterate the importance of remaining patient towards the next rate hike: “Many participants regarded dropping the “patient” language in the statement, whenever that might occur, as risking a shift in market expectations for the beginning of policy firming toward an unduly narrow range of dates. As a result, some expressed the concern that financial markets might overreact, resulting in undesirably tight financial conditions.” This is another indication that even though many of the FOMC members may consider raising rates in the coming months, they still don’t want to commit to a time frame and wish to trend very lightly when it comes to changing their policy. The reaction of GLD, however, was subtle, as prices slightly came up yesterday. Source of data taken from FOMC’s website and Google Finance The minutes also revealed that the FOMC members consider the global economic developments as one of the factors that could determine the Fed’s next move: “The Committee further decided that the postmeeting statement should explicitly acknowledge the role of international developments as one of the factors influencing the Committee’s assessment of progress toward its objectives of maximum employment and 2 percent inflation.” Perhaps the latest problems in Europe and the economic slowdown in other leading countries are starting to shift FOMC members’ opinion towards keeping rates low for a bit longer. Next week, Fed Chair Yellen is expected to testify before Congress; this testimony could provide additional input into what’s next for the Fed and whether there is a chance of a delay in the expected rate hike this summer. The ongoing problems in Europe, mainly the debt problems of Greece, could play in favor for precious metals investments such as GLD. The recent news is that Greece is still scrambling towards reducing some of the austerity measures that were agreed in the past, including reducing the budget surplus from 4.5% to 1.5% of its GDP. Some estimate that Greece could run out of cash by March. Moreover, Greek banks have been losing €2 billion in deposits per week, which will only put more pressure on the recently-elected Syriza government to reach an agreement with the EU. These developments are also likely to pressure down the euro against the U.S. dollar. Stronger dollar The recovery in the U.S. dollar has slowed down in the past few weeks, but the U.S. dollar could see additional gains in the coming months, especially if global economic slowdown persists. Further, as other central banks cut down rates (Bank of Canada and RBA) and implement QE programs (ECB and BOJ); these changes are likely to keep the U.S. dollar stronger. FOMC members voiced their concern over a stronger U.S. dollar: “…the increase in the foreign exchange value of the dollar was expected to be a persistent source of restraint on U.S. net exports, and a few participants pointed to the risk that the dollar could appreciate further.” (click to enlarge) Source of data taken from FRED Even though the recovery of the U.S. dollar at the beginning of the year coincided with the rise of GLD, the linear correlation between the two data sets was still strong and negative at the beginning of the year. Source of data taken from FRED This is only an indication that if the U.S. dollar were to resume its rally, this could have an adverse impact on the price of GLD. For now, the problems in Europe and the economic slowdown in China, which is another concern FOMC members reiterated in the last minutes, could still bring down the U.S. treasury yields. U.S. treasury yields, as I pointed out in the past, tend to have a negative relation with the price of GLD. Nonetheless, yields have gone up in the past several weeks, as the market increased the odds of the FOMC raising its cash rate in the coming months. Therefore, we still have sort of a stalemate when it comes to GLD: Higher uncertainty in Europe, weaker growth in China, and falling prices, which are likely to reduce the odds of the rate hike this summer, are keeping the demand for GLD up. Conversely, the ongoing rise in U.S. treasury yields, stronger U.S. dollar, and the slow recovery in the U.S. economy, partly due to low oil prices, are pressuring down GLD prices. Who will eventually win this stalemate? It’s hard to say at this point. So far, GLD hasn’t done much in the past year, and until the FOMC makes its next move, GLD isn’t likely to budge a whole lot from its current level. We could see some short-term gains, especially as the uncertainty around Greece further unfolds, and if the FOMC continues to voice its concerns over the global economy. For more see: 3 Questions About Gold Disclosure: The author has no positions in any stocks mentioned, and no plans to initiate any positions within the next 72 hours. (More…) The author wrote this article themselves, and it expresses their own opinions. The author is not receiving compensation for it (other than from Seeking Alpha). The author has no business relationship with any company whose stock is mentioned in this article.