Tag Archives: alternative

TerraForm Power: Go Long On Renewable Energy
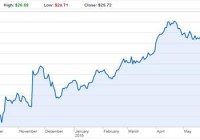
Summary TerraForm’s assets are new and efficient. Dividend guided by management to increase over 50% by 2017; yield on cost of 8% at currrent prices. Yieldco structure gives the company a highly visibile pipeline, external wind power acquisitions change the game. Shares are heavily undervalued at current prices. I’m long and you should be too. TerraForm Power, Inc. (NASDAQ: TERP ) is one of a few relatively new yieldcos trading in the market today. The company was set up to operate SunEdison (NYSE: SUNE ) assets in solar energy, but has since expanded to offer wind energy production as well. The current portfolio totaled 1,883 MW at the end of Q2 2015, but there has been 788MW worth of acquisitions already announced in 2015 and the company has call rights on 3,716MW of production that is under construction by SunEdison. Currently, the majority of assets are held in the United States (71%) and the United Kingdom (20%). From a management perspective, the relationship between TerraForm and SunEdison means that investors stand to benefit from SunEdison’s expertise as a large player in renewable energy design and downstream operations. The majority of TerraForm Power management worked at SunEdison so there is deep industry knowledge in the management suite in regards to predicting capital expenditures and industry ties to other third parties in the industry. Yieldcos have increased in popularity over the past few years, especially within the renewable energy space. Investors new to the concept can view a yieldco in a similar light to the more familiar master limited partnership (MLP) structure. Yieldcos do not pay corporate taxes and only completed, revenue-generating assets are held within the structure, attracting investors seeking low risk and stable cash flow. In return, parent companies get access to lower costs-of-capital while still retaining the majority voting interest on their assets. (click to enlarge) Shares have taken a dive in July and now trade below the initial IPO price in 2014. Is this warranted or does the company present a substantial opportunity at current prices? What steps has management taken over the past year and how does the asset pipeline look? Wind Diversification TerraForm has significantly diversified its power generation into wind assets in 2015. Starting with the FirstWind acquisition that closed in 2015 (500 MW), the company acquired an additional 1,451MW of wind energy from Atlantic Power and Invenergy in June/July 2015. By the end of 2015, all these transactions will have closed and TerraForm will be one of the largest wind power providers in the United States from basically having no wind assets just a year ago. In fact, starting in 2016 TerraForm will derive more power generation from wind than solar. This was a big deal for the company and these transactions catapulted TerraForm forward in the renewable energy markets. I like these acquisitions as they diversify the revenue base and will enhance scale in what currently is a highly fragmented renewable energy market. For a company that many viewed a year ago as just a depository for SunEdison solar assets, this has been a major change and management has a vision for the future. High Leverage Does Present Risks Due to the capital-intensive nature of the business and the corporate structure, traditional metrics like net debt/EBITDA and others are high. Current net debt/run-rate EBITDA stands at 5.1x, which should be something investors weigh before opening a position. Recent cash raises in the equity/debt markets have been all but used up to fund the recent transformative acquisitions mentioned. Current liquidity stands at just $646M (only $50M cash-on-hand plus the open revolver balance). Going forward in the short term, TerraForm’s large transactions are over in my opinion and the company will switch gears to focus on integration and cultivating existing production. Dividend Growth and Eventual Share Price The 2015 dividend is set to be $1.35/share, an annual rate of 4.46% at current prices. However, management has guided for the dividend to increase to $1.75/share in 2016 and $2.05/share in 2017. (click to enlarge) * TerraForm Investor Presentation At current prices of $25.33/share as of this writing, a dividend of $2.05/share in 2017 would give you a yield on cost of over 8% on your original investment. This is extremely solid and I think the market must either not understand the company or believe it cannot meet its dividend growth goals, which have been reiterated quite often in calls. Analysts have been quite direct on management’s view of share value and whether issuing further equity in the pipeline, to which Management has responded adamantly that they view the shares as undervalued at current prices and do not wish to raise capital this way. I think it is unlikely that current shareholders get diluted at current prices. Conclusion Shares are undervalued at current prices and the market sell-off from $40/share to current lows has been overdone. I picked up some shares at current prices today (to go along with my other two utility plays, Calpine Corporation (NYSE: CPN ) and AES Corporation (NYSE: AES )). In general, I think investors in utilities should seek out companies with young power plants with significant holdings in the next generation of power generation (natural gas, wind, solar) at cheap prices. TerraForm fits the bill. Disclosure: I am/we are long TERP. (More…) I wrote this article myself, and it expresses my own opinions. I am not receiving compensation for it (other than from Seeking Alpha). I have no business relationship with any company whose stock is mentioned in this article.
SRV: Trading At 20%+ Discount To NAV Due To Supply/Demand Imbalance

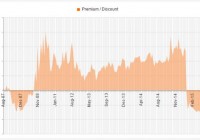
Summary Wave of investor outflows has created a significant dislocation. This provides an opportunity for those constructive on the MLP sector to obtain cheap exposure. For others, it also presents some potential to capture alpha through pair trades. Background on Closed-End Funds For those new to the space, a closed-end fund is a publicly traded investment company that raises a fixed amount of capital, and is then structured, listed and traded like a stock on a stock exchange. Whereas conventional mutual funds and ETFs frequently redeem/issue new shares to ensure that the price per share remains in line with the net asset value of the underlying holdings in the funds, this is not the case for CEFs. Rather, the share price of CEFs is driven by the market forces of supply and demand, which sometimes creates attractive opportunities to buy stakes at big discounts to NAV. This tends to happen when sentiment for the particular sector on which a CEF focuses gets decimated, causing some investors to sell irrespective of price. MLPs are one area where we can see this phenomenon most prevalently today. Amidst plummeting commodity prices and rising rate concerns, investor outflows have caused several MLP-focused CEFs to trade at among the widest discounts to NAV in the CEF universe. This presents some opportunities for those that desire cheap exposure to the sector, as well as those that are agnostic on the sector and just want to collect some alpha. Though there are a few examples of other funds worth considering, including Kayne Anderson Energy Development Co (NYSE: KED ) and Cushing Royalty & Income Fund (NYSE: SRF ), in this article, I focus on the Cushing MLP Total Return Fund (NYSE: SRV ) mainly due to the benefits of its large/liquid portfolio and relatively high institutional ownership. As shown below, SRV is currently trading at a ~22% discount to NAV. (click to enlarge) Source: CEF Connect Cushing MLP Total Return Fund Overview SRV is a moderately sized/liquid fund launched in late 2007, which currently has approximately $209 million of total net asset value. The fund’s mandate is to obtain capital appreciation and current income, typically by investing at least 80% of its NAV in MLPs based upon bottom-up fundamental research. The two partners overseeing the fund (bios included here ) each have several decades of experience in the space. The fund’s performance since inception has been poor, at approximately -7% per annum. However, this largely reflects the general downturn in MLPs/commodities over this period as opposed to poor security selection. As shown below, the current portfolio is diversified across a number of MLP subsectors, and is composed of mostly relatively large, liquid names. Annual portfolio turnover is relatively high (~137%), which I view as a marginal negative due to the fact that this can lead to somewhat higher transaction costs. The fund’s annual management fee is moderate at 0.75%, but its total expense ratio (excluding interest and dividends) is higher than average at approximately 2.6% of NAV. Unlike direct holdings in MLPs, SRV does not generate unrelated business taxable income, and Cushing therefore notes that the fund is suitable for IRAs and other tax-exempt accounts. Source: Cushing What will Cause the Discount to Compress? Whenever sentiment in the MLP sector eventually stabilizes and net investor outflows dry up, it is likely that much of SRV’s discount to NAV will naturally dissipate (for the bulk of the fund’s life, it has actually traded at a premium to NAV as can be seen in the first chart above). However, even if simple supply/demand do not naturally compress the discount, there are a couple of other drivers that could. First, SRV has a moderate annual distribution yield of 6.75% (based on current market price). As part of this represents return of capital, the fund partially self-liquidates over time. In addition, the fund has a reasonably concentrated investor base compared to its peers, with institutions holding approximately 24% of shares outstanding. To the extent that a significant discount were to persist over time, these large investors would be incentivized to pressure management to take additional steps to reduce it (e.g., through buybacks or increased distributions). Source: Nasdaq Trade Structuring For investors that want exposure to MLPs, this CEF provides cheap exposure. However, it also presents some potential opportunity to collect alpha for those that are agnostic (or negative) on the space, through pairing a long position in SRV with a short position in an MLP ETF (either through outright equity or options). Though there are several possible shorts to consider, one of the most actionable is the ALPS Alerian MLP ETF (NYSEARCA: AMLP ). This is a large ETF with approximately $8.4 billion of net assets and average daily trading volume of ~$72 million. It is currently relatively easy to borrow, with a rebate rate under -3.5% through some retail brokers, and also has listed options (which can enable investors to avoid dividend costs). The fund seeks to track the Alerian MLP Infrastructure Index, and 7 of its top 10 holdings overlap with SRV’s top 10. Risks/Considerations The obvious risk of this trade is that the timing of discount convergence is unclear, and if investors’ macro fears over commodities/rates grow, there is a possibility that the discount could grow even larger over the near term. The main mitigants are the facts that, as discussed above, the investor base is relatively concentrated with institutional investors, and the fund pays a moderate distribution yield. Short selling, of course, also comes with added risks (e.g., possibility of force buy-ins, increasing borrow costs, etc.) and likely should not be attempted by those new to the market. Disclosure: I/we have no positions in any stocks mentioned, but may initiate a long position in SRV over the next 72 hours. (More…) I wrote this article myself, and it expresses my own opinions. I am not receiving compensation for it (other than from Seeking Alpha). I have no business relationship with any company whose stock is mentioned in this article.

HEDJ: Is There Any More Upside In This Euro-Hedged ETF?

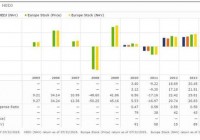
Summary The euro hit a 10-year low relative to the dollar and depreciated dramatically by 22% over a 12 month period leading into April of 2015. As the recent resistance and ostensible capitulation in the euro has taken hold investors may be better positioned in a long non-hedged European position. Since the sharp fall in the euro has subsided over the past four months, the two currencies appear to be normalizing against each other. Resistance has been seen at $1.05 (EU/USD) and the disparity between the two currencies has been retracing towards this level. Over the past 4 months a significant performance divergence exemplifies this phenomenon between hedged (HEDJ) and non-hedged (VGK) European ETFs. Introduction: In my previously published articles (on April 6th 2015: ” The Inevitable Capitulation Of The Euro Hedge ” and on May 20th 2015: ” The Inevitable Capitulation Of The Euro Hedge has begun “), I posited rotating money out of the WisdomTree Europe Hedged Equity (NYSEARCA: HEDJ ) ETF into a long non-hedged European equity position such as the Vanguard FTSE Europe ETF (NYSEARCA: VGK ). This thesis was rooted in three major pillars: 1) The Euro had depreciated relative to the dollar by more than 20% leading into April of 2015. 2) The currency disparity rendered a 10-year low for the euro relative to the dollar. 3) The Euro hedge within HEDJ had been largely attributable to this outperformance over an 18 month time period through April of 2015 relative its indices. Now four months later, two additional attributes may further support this thesis: 1) The Greece crisis is behind us and while this situation was not factored in to my previous articles as a potential event, this fiasco did not negatively impact the euro beyond the $1.05 resistance level. 2) As a looming interest rate increase by the Federal Reserve is on the horizon, this inevitable event may be priced in to some extent and thus the impact on the currency discrepancy may not be as dramatic as previously thought. This partial priced in event will mitigate the downside effect of the euro relative to the dollar when an interest rate increase takes place. Investors in the WisdomTree Europe Hedged Equity ETF have been rewarded handsomely over the past year leading into April of 2015 as the euro has depreciated relative to the dollar in spectacular fashion by more than 20% through March of 2015. HEDJ possess a hedge component exploiting this currency difference on the side of the US dollar, thus investors are rewarded as the euro weakens in relation to the dollar. I posited that this hedge may inevitably become a liability as the two currencies normalize against each other and thus back in April it was time to be in the sell camp of this hedged ETF prior to this hedge component working against investors in HEDJ. I suggested, as Europe continues to strengthen throughput 2015 and beyond, investors may be better positioned in a long European holding such as the Vanguard FTSE Europe ETF as opposed to the euro-hedged HEDJ. This article revisits this thesis four months removed to quantitatively assess the recent movement in the dollar and its impact on the performance of the hedged and non-hedged ETFs. The hedge: the depreciating euro relative to the US dollar HEDJ has outperformed its non-hedged index by a wide margin in 2014 and 2015 albeit through March. HEDJ outperformed the Morningstar non-hedged Europe Stock index on an annual basis by 11.3% and 11.9% in 2014 and 2015 (through March), respectively (Figure 1). However that outperformance of 11.9% through March has given up ground and has since fallen to an outperformance spread of 7.6% YTD (Figure 1). Per WisdomTree, HEDJ seeks to provide investors with exposure to European equities with a built-in hedge against the euro while focusing on companies that conduct a significant portion of their business overseas (non-euro exposure). “The Index and Fund are designed to have higher returns than an equivalent non-currency hedged investment when the value of the U.S. dollar is increasing relative to the value of the euro, and lower returns when the U.S. dollar declines against the euro.” This currency hedge has played out well for investors as the euro has slid against the dollar over the previous 12 months through March of 2015 (Figure 2). The euro sat at a 10-year low against the dollar with a sharp 22% depreciation seen over the previous 12 months heading into April of 2015 (Figures 2 and 3). A sharp divergence between the two currencies can be seen in figures 2 and 3, demonstrating this 20% slide. From these data, I stated that currency fluctuations are transient over the long-term, thus the euro hedge will likely capitulate in the near term. (click to enlarge) Figure 1 – Morningstar annual performance of HEDJ relative to a non-hedged Morningstar Europe Stock index (click to enlarge) Figure 2 – Google Finance graph showing the euro depreciation relative to the dollar over the previous 12 months leading into April of 2015 (click to enlarge) Figure 3 – Google Finance graph showing the euro depreciation relative to the dollar over the past 10 years heading into April of 2015. The capitulation of the euro hedge may be unfolding Recent data suggests that the perpetual falling of the euro may be coming to an end relative to the dollar (Figure 4). There also appears to be a firm resistance at ~$1.05. The euro touched down twice at or near $1.05 in Mach and April (Figure 4). Given the most bullish case for the dollar, some analysts are projecting the dollar to hit $0.95 by the end of the year. Assuming that the dollar hits that mark, this translates into another ~9% move after the already 22% move. Investors may be safe remaining in the hedge for now without much upside given the most bullish case. Given the most bullish estimates, I’d be content capturing over 70% of that spread and rotating money out of that position into a long European position such as VGK if investors would like to maintain exposure to European equities. (click to enlarge) Figure 4 – Google finance YTD performance of the euro relative to the dollar Hedge verses non-hedge performance: HEDJ and VGK Taking a close look at a long European ETF position via VGK (which I wrote about in detail here ) in comparison to the euro hedged HEDJ over the long-term exemplifies that currency fluctuations are transient over the long-term and this euro hedge will likely continue to capitulate in the near term. In 2012 and 2013 HEDJ underperformed VGK on an annual basis at times when the euro and dollar were mostly stable relative to each other (Figure 5). This hedge play has been highly favorable for investors over the most recent 12 month time period through March of 2015 however the currencies will inevitably start to trend to the inverse of this hedge as recent data suggests. At the point of initial reversion to the mean, this hedge will essentially be rendered useless and VGK will outperform as it did in 2012 and 2013. As the euro depreciation seems to have been arrested, HEDJ will likely continue its capitulation and underperform with any further uptick in the euro. This has been the case over the past four months, where VGK has outperformed HEDJ by 3.0% (Figure 6). These data suggest that VGK may be superior moving into the future and combined with the recovery in Europe, it may be time to abandon HEDJ and be long European equities without the euro hedge prior to the hedge working against the investor. (click to enlarge) Figure 5 – Morningstar annual return comparison between HEDJ and VGK through March of 2015 (click to enlarge) Figure 6 – Performance divergence between VGK and HEDJ over the previous four months since my initial article Conclusion: HEDJ has outperformed the non-hedged Morningstar Europe Stock index on an annual basis in 2014 by 11.3% and 11.9% through March in 2015. It is noteworthy to point out that this 11.9% outperformance has dwindled down to a 7.6% outperformance YTD. Specifically regarding HEDJ vs VGK, HEDJ maintains an outperformance of 11%, down from 14.3% since my last article in April. The hedge against the euro within HEDJ is largely attributable to this outperformance over the 12 month time period through March. Considering that the euro appears to have capitulated from its 10-year low preceded by a sharp depreciation by more than 20% indicates that this hedge may have played out. Continued exposure to this hedge may inevitably become more of a liability as the two currencies normalize against each other and thus it may be time to take profits. As Europe continues to strengthen throughput 2015 and beyond, investors may be better positioned in a long European ETF such as VGK. If the European economic strength is enough to mitigate the dollar rise after the Federal Reserve increases rates then there’s limited upside to remaining in this hedge. In terms of quality attributes, HEDJ lacks adequate diversification (by design) and provides a dividend yield inferior to that of VGK and the expense ratio is 6 times that of VGK (0.58%). Taken together, this euro hedge has provided investors with great returns however data suggest currency fluctuations are transient over the long-term and this euro hedge may not add any additional value to one’s portfolio moving into the future. Disclosure: The author currently holds shares of VGK and is long VGK. The author does not hold shares of HEDJ. The author has no business relationship with any companies mentioned in this article. I am not a professional financial advisor or tax professional. I am an individual investor who analyzes investment strategies and disseminates my analyses. I encourage all investors to conduct their own research and due diligence. Please feel free to comment and provide feedback. I value all responses. Disclosure: I am/we are long VGK. (More…) I wrote this article myself, and it expresses my own opinions. I am not receiving compensation for it (other than from Seeking Alpha). I have no business relationship with any company whose stock is mentioned in this article.