Tag Archives: alternative

17% Annual Return With Niska

Summary Niska trades at a substantial discount to its deal price. The buyers went into this with open eyes. The regulators know that NKA needs this deal. Deal Target Description Niska Gas Storage Partners (NYSE: NKA ) operates North American natural gas storage assets. They have storage facilities in Alberta, California, and Oklahoma. Deal Terms On June 14, 2015, Brookfield Infrastructure announced that it would buy NKA for $4.225 per unit in cash. NKA: (click to enlarge) Brookfield Infrastructure: (click to enlarge) Deal Financing The deal is not conditioned upon financing. NKA worked with both Evercore Partners (NYSE: EVR ) and Greenhill (NYSE: GHL ) on the deal. Deal Conditions The deal closing is expected to occur in the second half of 2016. Specifically, my estimates include the assumption that the deal closes in early December 2016. The deal is conditioned on standard closing conditions and regulatory approvals, including approval by the California Public Utilities Commission/PUC. Riverstone Investment Group, which owns 53% of NKA, supports the deal. No additional unit holder action is needed. The California PUC application was filed in July. That review will probably be the gating item. The HSR application was filed in July. Competition Canada was filed in July. The information statement will be filed with the SEC in early fall. Deal Price The price equaled a 222% premium to the NKA market price. It appears to be reasonable for NKA unit holders in the context of historically comparable transactions. (click to enlarge) (click to enlarge) Merger Agreement Specific Performance: Irreparable damage would occur in the event that any of the provisions of this Agreement (including each Party’s obligations under Article II or Section 6.3) were not performed in accordance with its specific terms or were otherwise breached. In the event of any breach or threatened breach by any Party of any covenant or obligation contained in this Agreement, the non-breaching Party shall be entitled (in addition to any other remedy that may be available to it, including monetary damages) to seek and obtain (on behalf of itself and the third-party beneficiaries of this Agreement) (A) an Order of specific performance to enforce the observance and performance of such covenant, agreement or obligation, and (B) an injunction restraining such breach or threatened breach. No Party or any other Person shall be required to obtain, furnish or post any bond or similar instrument in connection with or as a condition to obtaining any remedy referred to in this Section 13.14, and each Party irrevocably waives any right it may have to require the obtaining, furnishing or posting of any such bond or similar instrument. Material Adverse Effect means any change, event, circumstance, development or occurrence, individually or in the aggregate, with all other changes, events, circumstances, developments and occurrences, which has had, or would reasonably be expected to have, a material adverse effect on the financial condition, business, assets or results of operations of the Company Entities, taken as a whole; provided that with respect to this clause none of the following, and no fact, change, event, circumstance, development, occurrence or effect to the extent arising out of any of the following, shall constitute or be taken into account in determining whether a Material Adverse Effect has occurred, or may, would or could occur: changes in GAAP or changes in the regulatory or accounting requirements or in the interpretation of any of the foregoing, changes in the financial or securities markets or changes in the general economic or political conditions in the United States, Canada or abroad, changes in the price or availability of gas, oil or commodities or changes in currency exchange rates, changes (including changes of Applicable Law) or conditions generally affecting any industry in which any of the Company Entities operates, acts of war, sabotage or terrorism, any decrease in the market price of the Common Units or any delisting of the Common Units due solely to such decrease in the market price of the Common Units, any litigation initiated solely by a Person other than Swan Sponsor or any Affiliate of Swan Sponsor or a Company Entity or any Affiliate of a Company Entity (excluding suits brought in a derivative manner) arising from allegations of a breach of fiduciary duty or other violation of Applicable Law relating to this Agreement or the transactions contemplated by this Agreement (or any public disclosure relating to such litigation), the announcement, pendency or consummation of the transactions contemplated by this Agreement (including any cancellations of or delays in customer orders or other decreases in customer demand, reduction in revenues, work stoppages or loss or threatened loss of employees or other employee disruptions) (provided, that this clause (viii) shall not apply in the determination of a breach or violation of the representations and warranties contained in Section 4.8), changes or announcements of potential changes in a credit or financial rating in respect of any of the Company Entities or any indebtedness of any of the Company Entities, any failure to obtain any consent, approval, waiver or authorization from any third party in connection with the consummation of the transactions contemplated hereby (provided, that this clause (X) shall not apply in the determination of a breach or violation of the representations and warranties contained in Section 4.8, any failure of any of the Company Entities to meet any internal or published or third-party budgets, estimates, projections, forecasts or predictions of financial performance (including revenue, earnings, cash flow, cash position, liquidity or other financial measures) for any period, any action taken (or omitted to be taken) at the request of or by or on behalf of Parent, Merger Sub or any of their respective Affiliates, any action taken by Swan Sponsor, ManagementCo, the Company or any of their respective Affiliates that is required or expressly contemplated or permitted pursuant to this Agreement, or any seasonal reduction in the revenues or earnings of any of the Company Entities; provided, however , that the foregoing exclusions in (I), (II), (III), (IV) and (V)shall not apply to the extent such changes or effects have a materially disproportionate adverse effect on the Company Entities, taken as a whole, as compared to other independent natural gas storage businesses in the United States or Canada, and (Y) the underlying cause of any decrease or change referred to in clause (vi), (IX) or (xi) (if not otherwise falling within any of clauses through (XIV) above) may be taken into account in determining whether there is a “Material Adverse Effect” or the ability of Swan Sponsor, ManagementCo or the Company to perform their respective obligations under or arising out of this Agreement. Deal Alternatives No deal alternatives are expected. Event Driven Investing with Equity Options The best way to set this up is with equities; there are no derivative contracts that improve upon the equity’s risk:reward. Conclusion At today’s price, NKA units are yieldy candidates for consideration as a part of a diversified, long-term portfolio. Other master limited partnership opportunities to consider include Williams Partners (NYSE: WPZ ) and the Cushing MLP Total Return Fund (NYSE: SRV ). Disclosure: I am/we are long NKA, SRV. (More…) I wrote this article myself, and it expresses my own opinions. I am not receiving compensation for it (other than from Seeking Alpha). I have no business relationship with any company whose stock is mentioned in this article. Additional disclosure: Chris DeMuth Jr is a portfolio manager at Rangeley Capital. Rangeley invests with a margin of safety by buying securities at deep discounts to their intrinsic value and unlocking that value through corporate events. In order to maximize total returns for our investors, we reserve the right to make investment decisions regarding any security without further notification except where such notification is required by law.
Invest In Africa’s Growth Through The Market Vectors Africa Index ETF

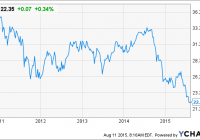
Summary The Market Vectors Africa ETF provides diverse exposure to Africa’s growth, and strategically invests over 40% of its assets in the banking industry. Earnings for 9 out of 10 of the fund’s top ten holdings increased, as the fund’s price sharply dropped in 2014. The Global X MSCI Nigeria ETF is extremely undervalued at the moment, and presents a unique buy opportunity for those willing to risk investing in a low oil price environment. The Market Vectors Africa Index ETF (NYSEARCA: AFK ) is the simplest and most efficient solution for investors to gain exposure to Africa’s economic growth. The fund has experienced a sharp drop in price since 2014, which is not at all correlated to the financial earnings of the fund’s major holdings. This has created substantially low valuation for the fund. Moreover, the economic outlook for Africa is favorable, with overall projected growth in the country’s that the fund invests into. Demographics in this region are also favorable, as the population is growing by more than 2% and 43% of the population is younger than 15. Moreover trends of urbanization are rising, although approximately 70% of the population earns their income from agriculture. That being said, Africa certainly has challenges ahead of it, and this fund is most appropriate for investors who are willing to take a long term horizon, and confidently hold if the fund experiences a further drop in price. Growth projections for this region have been lowered to 4.2%, with a slightly higher forecast for 2016 and 2017; this is due to concerns with the impact of low oil prices on Algeria and Nigeria, and difficulties in electricity supply in South Africa. While fully acknowledging these threats, I still remain bullish on Africa and believe that some options listed on U.S. Exchanges, although there are not many, provide ample opportunities for investors to gain exposure to Africa’s future growth. AFK data by YCharts 12 Month Economic Outlook Overall, the economic outlook for the five main countries that the fund invest into looks favorable. Average annual GDP growth was recently 3.65%, and is projected to increase to 4.1% in the next 12 months, an accurate projection of the projections for Sub Saharan Africa. Consumer Spending is projected to increase by around 3.3% for these countries, with the highest growth being in Morocco and Kenya. Areas of concern include the projected decrease in exports, and the issues previously mentioned with South Africa and Nigeria. Annual GDP Growth Annual GDP Growth Projection in 12 Months 12 Month Consumer Spending Growth Projection 12 Month Export Increase Projection Nigeria 3.96% 5.08% 2.3% -1.4% Egypt 3% 5% -0.4% -10.9% South Africa 2.1% 2.1% -2% 3.3% Morocco 4.3% 2.76% 7.3% -1.8% Kenya 4.9% 5.46% 9.4% -5.4% Top Fund Holdings By examining the fund’s top ten holdings , it is clear to see the sharp drop in fund price was not correlated to the fund’s financial performance, and has created an excellent buy opportunity. While the fund’s price dropped substantially in 2014, all companies, except for Nigeria Breweries PLC, were able to increase in net income. Banking industry The baking industry in Africa has a very favorable outlook and substantial growth ahead, which is another positive driver for this fund, which invests around 40% of its assets in this industry. Financial performance of the fund’s holdings was excellent, with the five companies having an average of 14.8% increase in net income during 2014. The widespread introduction of mobile banking throughout Africa has been a huge catalyst for the industry’s growth, and the high unbanked population in Africa provides room for further growth in this industry. The holdings in the banking industry in this fund have extremely attractive valuation, and represent a positive compliment to the high valuation of Nigeria’s consumer product industry. Unfortunately none of these companies are listed on U.S. exchanges, but can be considered a positive driver for the fund Nigeria Focus While the negative impact of Boko Haram and low oil prices should certainly be considered negative drivers for Nigeria, the country has key strengths in multiple industries that offsets this risk. The rise of the consumer products industry and banking industry in Nigeria, coupled with massive infrastructural developments, have resulted in an economy that is more diversified and less vulnerable to oil prices. While Its export earnings are highly dependent on the price oil, the country’s GDP is extremely diversified, with oil only attributing to 14% of the country’s GDP. The consumer products industry is on the rise, although valuation is a concern, and the banking industry also displays ample potential. Oscar Onyeama, CEO of Nigerian Stock Exchange, made the following statement about the declining price of oil’s impact on Nigeria’s economy: The effects of the declining oil prices can be felt in nearly all areas of our national life; from the pressure on the naira, which has led to the central bank of Nigeria’s spending over $4.7 billion to defend the national currency, through the impact on the capital markets with foreign investors taking a wait and see attitude in the last couple of months, to federal government budget deficits. While the decrease in oil prices has certainly put a strain on Nigeria’s economy, there is certainly growth and attractive valuation to be found in other industries. The Global X MSCI Nigeria ETF (NYSEARCA: NGE ) is an excellent way to gain exposure to Nigeria, has a wide variety of industries developing outside of the oil industry. Its current valuation is among the lowest of ETFs in Asia and Africa, and has substantial growth ahead of it. Investors who are willing to take the risks associated with geopolitics and the country’s dependency on oil prices, will be rewarded with the fund’s low valuation and high growth potential. While general exposure to Africa, through AFK, is the most conservative endeavor for investors, specifically identifying opportunities in Nigeria provides the opportunity for higher returns, by taking advantage of the fund’s current low valuation; it currently has a P/E of 9. Conclusion The Market Vectors Africa Index ETF is an excellent means for investors to gain exposure to Africa, due to its diversified holdings and low valuation. Investors who prefer a higher risk and less diversified investment approach, should strongly consider the Global X MSCI Nigeria ETF. Both funds have received an undeserved drop in price, and present an excellent buy opportunity for investors with a long term vision for Africa’s growth. Disclosure: I/we have no positions in any stocks mentioned, and no plans to initiate any positions within the next 72 hours. (More…) I wrote this article myself, and it expresses my own opinions. I am not receiving compensation for it (other than from Seeking Alpha). I have no business relationship with any company whose stock is mentioned in this article.

MLPJ: Yielding 9% With 18% Upstream Exposure

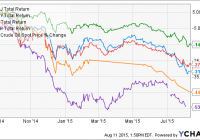
Summary Recent declines in the energy sector has punished small-cap energy stocks especially hard. MLPJ offers exposure to smaller-cap MLPs, as well as to other energy-related MLPs other than midstream MLPs. How has the MLP profile of MLPJ changed in the past six months? Introduction In a recent article , I provided an update on the Morgan Stanley Cushing MLP High Income Index ETN (NYSEARCA: MLPY ). This high-yielding, diverse MLP ETN was found to have reduced its exposure to upstream MLPs, which can be considered to be the most commodity price-sensitive segment of the MLP space. This change may potentially buffer MLPY against further declines in the price of crude oil. In the comment stream of that article, another user asked if the same phenomenon has occurred for the Global X Junior MLP ETF (NYSEARCA: MLPJ ). Therefore, this article seeks to address this question by analyzing the current holdings of MLPJ to determine whether its MLP profile has changed in the past six months. Moreover, this article describes the inclusion and weighting methodology for MLPJ, something that I did not cover in my previous article on MLPJ. MLPJ methodology MLPJ tracks the performance of the Solactive Junior MLP Compositive Index, which “is intended to give investors a means of tracking the overall performance of the small-capitalization segment of the United States master limited partnerships [MLP] asset class.” The inception of the ETF was January 14, 2013. Information for the methodology for MLPJ can be found on the Solactive website . The composition of the index is adjusted twice a year on the last business day of March and September. Therefore, the index has been adjusted only once since my last article on MLPJ. To be included in the index, an MLP must be focused on the “transportation, storage, processing, holding, refining, marketing, exploration, production, and mining with focus of natural resources”, and have a market cap of between $250M and $2.5B. It also must have an average daily trading volume of at least $500K in the last three months and a average monthly trading volume of at least 75K in each of the last six months. The 30-largest MLPs from this pool are then selected. The 30 MLPs chosen are then weighted according to market capitalization. The five-largest of these 30 have a maximum weighting capped at 9%, while the remainder are capped at 4.75%. The excess weight is allocated proportionally to all Index Components whose Percentage Weight is not capped. In summary, MLPJ is essentially a market-cap weighted index of the 30 largest energy-related MLPs under $2.5B. Recent performance The recent performance of MLPJ has not been pretty. Small-cap energy stocks were hit especially hard as investors fretted over the financial future of such firms. The following chart shows the 1-year total return performance of MLPJ and MLPY, as well as the benchmarks for the U.S. energy sector (NYSEARCA: XLE ) and the midstream MLP space (NYSEARCA: AMLP ). MLPJ Total Return Price data by YCharts The graph above shows that MLPJ’s performance (-31.4%) has been comparable to XLE (-27.3%) over the past twelve months. However, it has underperformed the midstream MLP ETF AMLP (-14.9%), while outperforming MLPY* (-44.5%). (*Note that the total return performance of MLPY, an ETN, may not be comparable to those of the other funds, which are ETFs, due to differences in tax treatment). Composition The constituents of MLPJ are given in the table below. Also shown is the % assets, ttm yield, market cap and type of each constituent . Note that as an ETN, the holdings of MLPJ are not publicly available on a daily basis. The % assets are obtained from the company while the ttm yield and market cap are obtained from Morningstar . In categorizing the type of company, I have used the classification types in the CBRE Clarion Securities MLP Master List website, which considers these following MLP or MLP-related classes: [i] traditionally structured midstream MLPs, [ii] upstream MLPs, [iii] traditionally structured other MLPs (“other”), [iv] variable distribution MLPs (“variable”), [v] MLP GP holding companies (“GP”), [vi] other publicly-traded companies that own GP interest in an MLP (“diverse”), and [vii] other MLP-related securities. Name Ticker Assets / % Yield / % Cap / B Type NORTHERN TIER ENERGY LP (NYSE: NTI ) 8.76 11.59 2.50 Variable CHENIERE ENERGY PARTNERS (NYSEMKT: CQP ) 7.36 5.41 10.50 Other ANTERO MIDSTREAM PARTNERS (NYSE: AM ) 5.92 2.06 3.40 Midstream FERRELLGAS PARTNERS-LP (NYSE: FGP ) 5.80 9.66 1.90 Other HOLLY ENERGY PARTNERS LP (NYSE: HEP ) 5.72 7.38 1.70 Other ALLIANCE RESOURCE PARTNER (NASDAQ: ARLP ) 5.70 10.93 1.80 Other NUSTAR GP HOLDINGS LLC (NYSE: NSH ) 5.65 6.78 1.40 GP EXTERRAN PARTNERS LP (NASDAQ: EXLP ) 4.29 11.02 1.20 Other MARTIN MIDSTREAM PARTNERS (NASDAQ: MMLP ) 4.25 11.48 1.00 Midstream SUMMIT MIDSTREAM PARTNERS (NYSE: SMLP ) 4.15 9.15 1.40 Midstream VALERO ENERGY PARTNERS LP (NYSE: VLP ) 4.05 2.30 2.80 Midstream VANGUARD NATURAL RESOURCE (NASDAQ: VNR ) 3.85 21.22 0.78 Upstream BREITBURN ENERGY PARTNERS (NASDAQ: BBEP ) 3.71 36.35 0.65 Upstream GLOBAL PARTNERS LP (NYSE: GLP ) 3.64 8.52 1.10 Other MEMORIAL PRODUCTION PARTN (NASDAQ: MEMP ) 3.57 29.18 0.61 Upstream ROSE ROCK MIDSTREAM LP (NYSE: RRMS ) 3.46 6.64 1.30 Midstream LEGACY RESERVES LP (NASDAQ: LGCY ) 2.71 24.84 0.55 Upstream TRANSMONTAIGNE PARTNERS LP (NYSE: TLP ) 2.40 8.21 0.53 Midstream EV ENERGY PARTNERS LP (NASDAQ: EVEP ) 2.40 24.77 0.46 Upstream CRESTWOOD EQUITY PARTNERS (NYSE: CEQP ) 2.37 15.49 0.66 GP DORCHESTER MINERALS LP (NASDAQ: DMLP ) 2.22 9.44 0.46 Variable WESTERN REFINING LOGISTIC (NYSE: WNRL ) 2.14 2.56 1.10 Midstream ALON USA PARTNERS LP (NYSE: ALDW ) 1.69 9.92 1.60 Variable ATLAS RESOURCE PARTNERS LP (NYSE: ARP ) 1.40 49.18 0.33 Upstream NATURAL RESOURCE PARTNERS (NYSE: NRP ) 1.24 32.47 0.34 Other FORESIGHT ENERGY LP (NYSE: FELP ) 0.81 13.88 1.00 Other VIPER ENERGY PARTNERS LP (NASDAQ: VNOM ) 0.74 4.93 1.10 Variable We can see from the table above that in addition to midstream MLPs (26%), MLPJ also contains a significant proportion of “other” (35%) MLPs. According to CBRE, “other” MLPs include all MLPs that are not midstream MLPs, but are structured like midstream MLPs (with a minimum quarterly distribution). These include coal, compression, shipping, oilfield services, wholesale distribution, and everything else. (Note: other authorities classify wholesale distribution as midstream). Examples of “other” MLPs in MLPJ include Ferrellgas Partners, a supplier of propane, and Alliance Resource Partners, a diversified coal producer and marketer. The allocations of MLPY are depicted in the chart below. How does this composition compare to six months ago ? The following chart shows the former, current and changes in the six categories of MLPs in MLPJ from six months ago to now. We can see from the chart above that the proportion of midstream holdings in MLPJ has decreased from 37% to 26%. Unlike MLPY , however, MLPJ has not seen a massive decline in upstream assets. The percentage of holdings in upstream MLPs decreased only slightly, from 19% six months ago to 18% today. The reason for this is that MLPJ, unlike MLPY, does not eliminate dividend cutters from its index. This is probably the reason why the upstream MLPs such as BBEP, which slashed its dividend in January of this year, survived the March rebalancing. Meanwhile, the upstream MLP ARP may yet see itself removed from the index if its market cap falls below $250M (its current market cap is $332M). Other notable changes the composition include an increase in the number of “other” MLPs, from 21% to 35%. An example of an “other” MLP to be added is the coal-based ARLP, which was added to the index as its market cap fell below $2.5B earlier this year. ARLP Market Cap data by YCharts Distribution Since my last article, MLPJ has paid out 3 more distributions. Unlike MLPY, however, which is an ETN and hence passes through the income received from its assets directly to unitholders, MLPJ is an ETF, which allows it to control its distributions. The last two quarterly distributions were increased by 1 cent each, representing increases of 4%. However, as some of this income may be return-of-capital, it is difficult to anticipate the sustainibility of the dividend going forward without a comprehensive analysis of the dividend future of each individual company. Risks MLPJ contains companies that are smaller in size compared to those found in the large-cap funds AMLP or AMJ. Moreover, energy-related MLPs are, to various extents, acutely sensitive to commodity prices, and the 8.80% distribution may or may not be sustainable. Additionally, there is a significant risk of capital loss if energy prices slide further. Finally, MLPJ’s expense ratio is 0.75%, which slightly lower than that for AMLP or JPMorgan Alerian MLP Index ETN (NYSEARCA: AMJ ) (0.85%). Conclusion This article was intended to provide an update on the MLP profile of MLPJ, a small-cap MLP fund, as requested by a reader. MLPJ’s midstream exposure was decreased by 10% (absolute percentage) while its “other” MLP exposure was increased by 14% (absolute percentage). Furthermore, and unlike MLPY (which has rules to eliminate dividend cutters from its index), MLPJ has not dramatically reduced its exposure to upstream MLP companies, which still remains at a robust 18%. The upstream MLP companies still remaining in MLPJ include VNR (3.85% of assets), BBEP (3.71%), MEMP (3.57%), LGCY (2.71%), EVEP (2.40%) and ARP (1.40%). Consequently, investors uncomfortable with owning upstream MLPs in any capacity should obviously avoid MLPJ due to its 18% exposure to upstream companies. On the other hand, more risk-seeking investors anticipating a rebound in oil prices actually favor MLPJ due to its 18% upstream MLP exposure. As upstream MLPs have fallen among the hardest as crude oil prices slid, it is not unreasonable to expect their share prices to snap back the quickest if oil prices do rebound. As there is no MLP fund dedicated exclusively to upstream MLPs, MLPJ may be a decent choice for investors who want exposure to upstream MLPs but are uncomfortable with picking individual companies. Disclosure: I/we have no positions in any stocks mentioned, and no plans to initiate any positions within the next 72 hours. (More…) I wrote this article myself, and it expresses my own opinions. I am not receiving compensation for it (other than from Seeking Alpha). I have no business relationship with any company whose stock is mentioned in this article.