Tag Archives: alternative

Warren Buffett And The Art Of Focus Investing

Summary Buffett (BRK.B) stated he would have a portfolio of 4-5 securities if he were managing smaller sums of money ($50 million, $100 million, or $200 million). Most value investors who use a focused approach significantly outperform the market. The secret to this approach is the Kelly Growth Formula for portfolio allocation. “If I were running $50, $100, $200 million, I would have 80 percent in five positions, with 25 percent for the largest. In 1964 I found a position I was willing to go heavier into, up to 40 percent. I told investors they could pull their money out. None did. The position was American Express after the salad oil scandal. ” -Warren Buffett; 2008 Berkshire Hathaway (NYSE: BRK.A ) Annual Meeting Source: Dang Le, “Notes from Buffett meeting 2/15/2008,” Underground value blog , February 23, 2008; also cited in The Kelly Capital Growth Investment Criterion by Edward Thorpe, William Ziemba, Leonard Maclean ” Back in the 1960s I actually took a compound interest rate table and I made various assumptions about what kind of edge I might have in reference to the behavior of common stocks generally. I knew from being a poker player that you have to be heavily when you’ve got huge odds in your favor (he concluded as long as he could handle price volatility, owning as few as three stocks would be plenty). I knew I could handle the bumps psychologically because I was raised by people who believed in handling bumps. So I was an ideal person to adopt my own methodology.” –Charlie Munger; D*mn Right! By Janet Lowe Introduction Today I briefly wanted to illustrate the concept of a focused investing approach. I remember when I started investing nobody ever seemed to have a methodology as to how many stocks to have in their portfolio or how to decide which amount/percentage to place of each stock in a given portfolio. Obviously there was the academic theory of diversification taught in most finance classes that advocated 50-100 stocks, but it continued to puzzle me that it was so difficult to find information on a more focused approach. In this article I’ll attempt to outline the parameters of a focused strategy that I use, and also list several resources on focus investing to hopefully save everyone time as finding all of this research was quite time consuming for me. Academic Theory, Diversification, and Value Investing Focus “The Berkshire-style investors tend to be less diversified than other people. The academics have done a terrible disservice to intelligent investors by glorifying the idea of diversification. Because I just think the whole concept is literally almost insane. It emphasizes feeling good about not having your investment results depart very much from average investment results. But why would you get on the bandwagon like that if somebody didn’t make you with a whip and a gun?” — Charlie Munger, 2005 There are no winners in the short-term, relative performance derby. Attempting to outperform the market in the short term is futile…The effort only distracts a money manager from finding and acting on sound long-term opportunities…As a result the clients experience mediocre performance…Only brokers benefit from the high level of activity. – Seth Klarman; quote taken from James Montier’s Value Investing Most universities and institutions teach that a diversified approach to investing is the best way to minimize risk and still obtain good results in the market. The majority of the investment community believes this, and most mutual funds own anywhere from 50-100 stocks with few exceptions. This approach typically leads to a return that is equal to or less than the S&P 500 and also causes most mutual fund performance to fall in a very narrow range. There is no incentive for the average fund manager to deviate from the norm as even one year of performance that is significantly less than his or her peers would probably result in the mutual fund manager being fired or severely reprimanded. Investment management companies reinforce this behavior as investment companies performing in-line with their peers don’t suffer significant losses of assets under management even if their long run performance is abysmal. A study by Randy Cohen et al. (2009; quoted in Montier’s Value Investing) the obsession with relative performance is one of the key sources of underperformance among active fund managers. Although 80-90% of fund managers underperform the S&P 500 averages in a given year, it is interesting to note how much the performance of fund managers top picks deviate from the average. Cohen’s study focused on the top 25% of “best ideas” among active managers and noted active fund managers “best ideas have a long-term average return of 19% per year vs. a market return of 12% over the same period. Best ideas were determined by portfolio allocation and looking at manager’s most significant holdings in size, especially those differing from weights in a typical index fund. If active managers followed a more focused approach and invested a larger percentage of their investable funds in their “best ideas,” both the managers and their clients would be a lot wealthier. In contrast to the diversified approach I described above that is praised by most academics and mutual fund managers there is a school of thought in the value investing community labeled “Focus Investing” by Robert Hagstrom of Legg Mason . This approach advocates putting your investable funds into a few securities and is based on a formula known as the Kelly Growth Criterion. As noted above, Warren Buffett advocates holding four to five securities using this approach and his partner Charlie Munger advocated an even more extreme approach, holding just three securities. This approach is often misunderstood, and there were a few questions on this topic at the Berkshire annual meeting this year. The main question was generally why Berkshire held so many securities and wasn’t “more focused.” Although at first glance this may appear to be true, let’s dig a little deeper to see just how focused the portfolios are. Despite holding roughly 50 stocks, Berkshire’s portfolio is still very focused with 63% of the portfolio invested in four securities (AXP, KO, IBM, WFC), and 82.10% invested in the top ten holdings (in addition to the four previously mentioned, positions five through ten are: WMT, PG, USB, DVA, MCO, GS) as of 3/31/2015. Although at first glance this focused investing approach may seem very risky, Joel Greenblatt tells a different story in his book You Too Can Be a Stock Market Genius noting that, “owning just two stocks eliminates 46 percent of the nonmarket risk of owning just one stock. This type of risk is supposedly reduced to 72 percent with a four stock portfolio, by 81 percent with eight stocks, 93 percent with 16 stocks, 96 percent with just 32 stocks, and 99 percent with 500 stocks.” Greenblatt seemed perplexed at why an investor would add hundreds of stocks to his portfolio to reduce risk by 3 percent. ROBERT HAGSTROM’S STUDY: DOES THE TYPICAL FOCUSED PORTFOLIO OUTPERFORM? ” The deleterious effects of such improbable events can best be mitigated through prudent diversification. The number of securities that should be owned to reduce portfolio risk to an acceptable level is not great, as few as ten to fifteen different holdings usually suffices.” — Seth Klarman, Margin of Safety In their study “Focus Investing: An Optimal Portfolio Strategy Alternative to Active versus Passive Management, ” Joan Lamm-Tennant, Phd., and Robert Hagstrom concluded that while a portfolio consisting of 15 stocks gives an investor a 1-in-4 chance of beating the market (S&P 500 index); a 250 stock portfolio reduces those odds to 1-in-50. Their study was based on 12,000 randomly assembled portfolios constructed with the following parameters: 3,000 portfolios with 250 stocks 3,000 portfolios with 100 stocks 3,000 portfolios with 50 stocks 3,000 portfolios with 15 stocks When sorting the ten year data, they found that 63 portfolios from group #1 (250 stocks) beat the market returns, 337 from group 2 (100 stocks) beat the market, 549 from group #3 (50 stocks) beat the market returns, and 808 from group #4 (15 stocks) beat the market’s return over the time period studied (1987-1996). Although the data below will show that the average portfolio returned less than the S&P 500 over that period (a particularly well performing period for large cap stocks), it also shows that as you reduce the number of stocks in a given portfolio, the probability of beating the returns of the S&P 500 increases. KELLY GROWTH CRITERION AND PORTFOLIO ALLOCATION “It is known that the great investor Warren Buffett’s Berkshire Hathaway actually has had a growth path similar to full Kelly betting.” – Scenarios for Risk Management and Global Investment Strategies; Rachel and William Ziemba “Discussion of Buffett’s concentrated bets gives considerable evidence that Buffett thinks like a Kelly Investor, citing Buffett bets of 25% to 40% of his net worth on single situations. — The Kelly Capital Growth Investment Growth Criterion: Theory and Practice, ” World Scientific Publishing Company, 2011; written by Thorpe, Maclean, and Ziemba. When I first started investing the most difficult topic for me was deciding how much of my portfolio to invest in a given position. This changed when I stumbled upon the Kelly Growth Criterion while reading through Ed Thorpe’s classic book on blackjack Beat the Dealer , after it was mentioned in Ben Mezrich’s book Bringing Down the House , which was later turned into a movie called “21.” The Kelly Growth Criterion is a probability based model that teaches one how much of his bankroll he should wager in a given situation, whether it’s gambling at a casino or investing in the stock market. Ed Thorpe mentions the Kelly Growth Formula in his classic book on Blackjack, “Beat the Dealer,” which became the foundation for the MIT Blackjack team as shown in the book Bringing Down the House: The Inside Story of Six MIT Students Who Took Vegas for Millions by Ben Mezrich. Interestingly enough the Kelly formula was not developed by J.L. Kelly (who it is named after) but rather by the incredible genius Claude Shannon as detailed in the excellent , Fortune’s Formula: The Untold Story of the Scientific Betting System that Beat the Casinos and Wall Street , by William Poundstone. After the formula was developed and published by Shannon another Mathematician, J.L. Kelly realized the formula could be applied to gambling, and the Kelly Growth Formula for gambling/investing was born. The formula is simply expressed as: 2p – 1 = X, where 2 times the probability of winning minus 1 equals the percentage of one’s bankroll that should be bet. For example, if the probability of beating the house is 55 percent, you should bet 10 percent of your bankroll to maximize profit. If the probability of beating the house is 70 percent you should bet 40 percent, etc. Kelly Growth: Application “We might invest up to 40% of our net worth in a single security under conditions coupling an extremely high probability that our facts and reasoning are correct with a very low probability that anything could change the underlying value of the investment.” – Warren Buffett; Letters to Investment Partners In his excellent book The Dhando Investor, Mohnish Pabrai outlines the application of the Kelly Growth Formula to Buffett’s 1964-67 investment in American Express (40% of partnership assets). Pabrai estimates the odds of this bet in a conservative case would be: Odds of 200% or greater return in three years – 90 percent. Odds of breakeven return in three years – 5 percent. Odds of a loss of up to 10 percent in three years – 4 percent. Odds of a total loss on the investment – 1 percent. Using the above odds, the Kelly formula would advocate betting 98.3 percent of assets on American Express according to Pabrai. Buffett invested an amount (40%) under the maximum suggested and placed a few other bets with the remaining 60% of assets. Pabrai gives several examples of ideal portfolio allocation in Dhando Investor, and also notes that several other famous value investors (Joel Greenblatt and Eddie Lampert) seem to be using a Kelly Approach. As noted above, Buffett’s ideal portfolio allocation places 25 percent of assets into the best idea, with the remainder allocated to four investments. Although Buffett has never advocated the Kelly formula, it seems that he uses it or some variation in his portfolio allocation. Kelly Growth: Target Investments “Good jockeys will do well on good horses, but not on broken down nags.” — Warren Buffett In a recent presentation for the website Singular Diligence , Tobias Carlisle did an excellent job describing and summarizing the ideal investment targets under a Kelly approach. On a side note, if you haven’t read Tobias Carlisle’s books Deep Value , and Quantitative Value , you are missing out — they are two of my all-time favorites. Carlisle suggested that the Kelly approach favors investments with the following characteristics: Stable, low risk targets. Reasonable valuation (free cash flow yield 8-10%) Growing bigger in the next 3-5 years. High Quality businesses High Quality Management. To summarize, one should focus on buying companies with wide economic moats at affordable prices. In addition placing large bets when pessimism is at a maximum (See Buffett’s 1964 AXP Investment) is also advantageous. Conclusion “If you are a professional and have confidence, then I would advocate lots of concentration. For everyone else, if it’s not your game, participate in total diversification. If it’s your game, diversification doesn’t make sense. It’s crazy to put money in your twentieth choice rather than your first choice.” — Warren Buffett (NYSE: BRK.B ); The Kelly Capital Growth Investment Criterion by Edward Thorpe, William Ziemba, Leonard Maclean “Of course, Charlie and I can identify only a few Inevitables, even after a lifetime of looking for them… Considering what it takes to be an Inevitable, Charlie and I recognize that we will never be able to come up with a Nifty Fifty or even a Twinkling Twenty. To the Inevitables in our portfolio, therefore, we add a few “Highly Probables.” – Warren Buffett; 1996 Berkshire Hathaway Letter to Shareholders In conclusion, if one has the time and resources a focused approach to portfolio management is ideal. Since I started my investment partnership I’ve consistently had 40-50% of AUM in 4 companies: Directv (NASDAQ: DTV ), Markel (NYSE: MKL ), Express Scripts (NASDAQ: ESRX ), and Davita (NYSE: DVA ); the only time the top 4 changed (added MasterCard (NYSE: MA ) to replace DTV) was when DTV was acquired by ATT. This approach can be frightening at times as your portfolio is exposed to any volatility driven by the largest positions, but in the long run the results are incredible. Appendix Examples of Modern Day Focus Investing in Practice Allan Mecham; Arlington Value Management Nelson Peltz; Trian Capital Chuck Akre; Akre Focus Fund (MUTF: AKREX ) Hennessy Focus Fund (MUTF: HFCSX ) Lou Simpson; SQ Advisors, LLC Tom Bancroft; Makaira Partners Resources: Recommended Reading Fortune’s Formula: The Untold Story of the Scientific Betting System that Beat the Casinos and Wall Street , by William Poundstone Probabilistic Reasoning by Amos Tversky and Daniel Kahneman Skin in the Game Heuristic as Protection Against Tail Events by Nassim Taleb and Constantantine Sandis Understanding Uncertainty by Dennis V. Lindley Scenarios for Risk Management and Global Investment Strategies by Rachel and Bill Ziemba The Kelly Capital Growth Investment Criterion by Edward Thorpe, William Ziemba, Leonard Maclean An Introduction to Probability Theory and Its Applications, Volumes 1-2 , by William Feller The Mathematics of Gambling by Edward O. Thorpe The Unfinished Game: Pascal, Fermat, and the Seventeenth-Century Letter that Made the World Modern by Keith Devlin The Dhando Investor by Mohnish Pabrai The Warren Buffett Portfolio by Robert Hagstrom More Than You Know: Finding Financial Wisdom in Unconventional Places by Michael Maubossin In an Uncertain World: Tough Choices from the Brink by Robert Rubin Judgment Under Uncertainty: Heuristics and Biases (Edited by Daniel Kahnemann, Paul) Value Investing by James Montier Margin of Safety by Seth Klarman Quantitative Value by Wesley Gray and Tobias Carlisle Deep Value by Tobias Carlisle Theory of Gambling by Richard Epstein Theory of Poker by David Sklansky Singular Diligence website ( singulardiligence.com ); Tobias Carlisle Kelly Criterion in Blackjack, Sports Betting, and the Stock Market by Edward Thorpe (available at edwardothorpe.com ) Beat the Dealer : A Winning Strategy for the Game of Twenty-One Bringing Down the House: The Inside Story of Six MIT Students Who Took Vegas for Millions by Ben Mezrich. Against the Gods The Remarkable Story of Risk by Peter L. Bernstein Winning Decision: Getting it Right the First Time by Paul Shoemaker and Edward Russo Disclosure: I am/we are long MKL, BRK.B, DVA, MA, ESRX. (More…) I wrote this article myself, and it expresses my own opinions. I am not receiving compensation for it (other than from Seeking Alpha). I have no business relationship with any company whose stock is mentioned in this article.
A Most Competitive Wealth-Builder ETF Investment Today

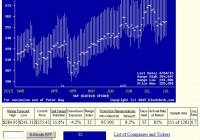
Summary From a population of some 350 actively-traded, substantial, and growing ETFs this is a currently attractive addition to a portfolio whose principal objective is wealth accumulation by active investing. We daily evaluate future near-term price gain prospects for quality, market-seasoned ETFs, based on the expectations of market-makers [MMs], drawing on their insights from client order-flows. The analysis of our subject ETF’s price prospects is reinforced by parallel MM forecasts for each of the ETF’s ten largest holdings. Qualitative appraisals of the forecasts are derived from how well the MMs have foreseen subsequent price behaviors following prior forecasts similar to today’s. Size of prospective gains, odds of winning transactions, worst-case price drawdowns, and marketability measures are all taken into account. Today a most attractive ETF Is the SPDR Biotech ETF (NYSEARCA: XBI ). The investment seeks to provide investment results that, before fees and expenses, correspond generally to the total return performance of an index derived from the biotechnology segment of a U.S. total market composite index. In seeking to track the performance of the S&P Biotechnology Select Industry Index (the “index”), the fund employs a sampling strategy. It generally invests substantially all, but at least 80%, of its total assets in the securities comprising the index. The index represents the biotechnology industry group of the S&P Total Market Index (“S&P TMI”). The fund is non-diversified. The fund currently holds assets of $2.71 billion and has had a YTD price return of +35.66%. Its average daily trading volume of 1,126,650 produces a complete asset turnover calculation in 9.4 days at its current price of $255.09. Behavioral analysis of market-maker hedging actions while providing market liquidity for volume block trades in the ETF by interested major investment funds has produced the recent past (6 month) daily history of implied price range forecasts pictured in Figure 1. Figure 1 (used with permission) The vertical lines of Figure 1 are a visual history of forward-looking expectations of coming prices for the subject ETF. They are NOT a backward-in-time look at actual daily price ranges, but the heavy dot in each range is the ending market quote of the day the forecast was made. What is important in the picture is the balance of upside prospects in comparison to downside concerns. That ratio is expressed in the Range Index [RI], whose number tells what percentage of the whole range lies below the then current price. Today’s Range Index is used to evaluate how well prior forecasts of similar RIs for this ETF have previously worked out. The size of that historic sample is given near the right-hand end of the data line below the picture. The current RI’s size in relation to all available RIs of the past 5 years is indicated in the small blue thumbnail distribution at the bottom of Figure 1. The first items in the data line are current information: The current high and low of the forecast range, and the percent change from the market quote to the top of the range, as a sell target. The Range Index is of the current forecast. Other items of data are all derived from the history of prior forecasts. They stem from applying a T ime- E fficient R isk M anagement D iscipline to hypothetical holdings initiated by the MM forecasts. That discipline requires a next-day closing price cost position be held no longer than 63 market days (3 months) unless first encountered by a market close equal to or above the sell target. The net payoffs are the cumulative average simple percent gains of all such forecast positions, including losses. Days held are average market rather than calendar days held in the sample positions. Drawdown exposure indicates the typical worst-case price experience during those holding periods. Win odds tells what percentage proportion of the sample recovered from the drawdowns to produce a gain. The cred(ibility) ratio compares the sell target prospect with the historic net payoff experiences. Figure 2 provides a longer-time perspective by drawing a once-a week look from the Figure 1 source forecasts, back over two years. Figure 2 (used with permission) What does this ETF hold, causing such price expectations? Figure 3 is a table of securities held by the subject ETF, indicating its concentration in the top ten largest holdings, and their percentage of the ETF’s total value. Figure 3 source: Yahoo Finance XBI apparently takes a low-concentration approach to holdings, with an average of 1½% of its assets in each of its top ten commitments. This provides a wide dispersion of holdings among competitive contestants in an industry where success rewards can be huge, while failures tend to be complete. If the remaining 88% of assets are distributed on a 1% basis over 85 separate additional bets may be made, offering great diversification, as well as dilution of encountered bonanzas. Where ultimate payoffs are less dependent on initial capital commitment size, this may be an advantaged strategy. Figure 4 is a table of data lines similar to that contained in Figure 1, for each of the top ten holdings of XBI. Figure 4 (click to enlarge) In an industry as unpredictably dynamic as this, wide variations in market experience seem to be the rule. Column (5) contains the upside price change forecasts between current market prices and the upper limit of prices regarded by MMs as being worth paying for price change protection. The average of +18.9% of the top ten XBI holdings is well above the population average of all 2500+ equities MM forecasts of +12.6%. It is about triple the upside forecast for the SPDR S&P 500 Trust ETF ( SPY) price change prospects. The other side of the coin is column (6), which shows what actual worst-case price drawdowns have been typical in the 3 months following each time there has been a forecast like those of the present day. Those risk exposures have averaged -10% in the holdings top ten, worse than -8.6% by equities at large, and only -3.3% on the SPY ETF. But these holdings have attractive reward tradeoffs between returns and risks, with the top ten (column 14) at a ratio of 1.8, compared to equities overall at 1.5 times. Still, the market average of SPY provides a best ratio of 2.1 times risk avoidance, at a cost of small reward. Another qualitative consideration is the credibility of the ten XBI big holdings after previous forecasts like today’s. The net average price change (column 13) of the ten has been 0.8 times the size of the upside forecast average, +18.9% compared to +15.6%. The equity population’s actual price gain achievement, net of losses has been a pitiful +3.4% compared to promises of 12.6%. The ability of XBI holdings to recover from those worst-case drawdowns and achieve profits occurred in 70% of experiences. The equity population only recovered less than two thirds of the time, and while the SPY experiences were more resistant than the ten XBI holdings, the achieved gains were much smaller. SPY has had only +3.7% gains previously from like forecasts of +6.8%. Conclusion XBI provides attractive forecast price gains, supported by its equally appealing largest holdings. Both the ETF and many of its major holdings offer very attractive prospects in near-term price behaviors, demonstrated by previous experiences following prior similar forecasts by market makers. The diversity of its holdings is very broad, providing a wide opportunity to share in constantly developing discoveries across the biotechnology field. Disclosure: I/we have no positions in any stocks mentioned, and no plans to initiate any positions within the next 72 hours. (More…) I wrote this article myself, and it expresses my own opinions. I am not receiving compensation for it (other than from Seeking Alpha). I have no business relationship with any company whose stock is mentioned in this article.

When Hedging Makes A Difference

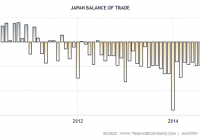
The fund takes advantage of hedging a strong U.S. Dollar against a weak Japanese Yen. The fund is heavily weighted towards industrial and auto manufacturers; major Japanese exports. The fund is passively managed with over 300 companies in the fund. Japan has been struggling to inflate its economy for decades. Immediately after his 2012 reelection, Japanese Prime Minister Mr. Shinzo Abe initiated a ‘three arrow plan’ consisting of fiscal stimulus, monetary easing and structural reforms all intended to attain a 2% annualized inflation rate. Although it was unprecedented and did have an immediate positive effect, the plan soon lost velocity. Complicating the matter, the massive 2011 earthquake and Tsunami which led to the destruction of the Fukushima reactors forced the government to order an immediate shutdown of all nuclear facilities. To replace the lost power generation, oil and gas imports increased dramatically, and by 2012 the increase in fuel imports had created a large trade deficit as demonstrated in the chart. (click to enlarge) Further, a value added tax increase caused consumers to reduce spending. At the very end of October 2014, BOJ Governor Mr. Haruhiko Kuroda unexpectedly announced a sizable expansion of the bank’s existing bond buying program. The Japanese Government Pension Fund simultaneously announced plans to double equity holdings. However, nearly 10 months later, chronic disinflation still persists in the Japanese. Recently, the IMF has called for Japan to expand its stimulus measures still further opining that the Bank of Japan’s current projections are “overly optimistic”. However, Mr. Kuroda considers that the growth policy remains on track and no further actions are required. Is this the right time to have exposure to the Japanese economy in your portfolio? Note though, it isn’t just the Japanese economy investors need to be concerned with. All economies phase in and out of business cycles. However, because of the extreme quantitative stimulus measures implemented for such an extended length of time, and often quite unexpectedly, it would be better to enter a position with a currency hedge. Deutsche Asset & Wealth Management offers the X-tracker MSCI Japan Hedged Equity ETF (NYSEARCA: DBJP ) . The fund’s objective is to track the performance, ” of the MSCI Japan U.S. Dollar Hedged Index. The index is designed to provide exposure to Japanese equity markets, while at the same time mitigating exposure to fluctuations between the value of the U.S. dollar and Japanese yen … ” The index is 100% hedged to the U.S. Dollar, selling Yen forward contracts at the one month forward rate. Should the Yen depreciate, the tracking index as well as the fund’s Net Asset Value is hedged against losses. Consumer Discretionary leads the fund’s sector allocation at 22.26% with 57 holdings, followed by Financials at 19.64% with 53 holdings; Industrials, 19.48% with 67 holdings; Information Technology, 11.14% with 41 holdings; Consumer Staples, 6.67% with 20 holdings; Health Care, 6.30% with 21 holdings; Materials, 5.92% with 28 holdings; Telecom Services, 4.96% with 4 holdings; Utilities, 2.45% with 11 holdings and Energy 0.91% with 5 holdings. (Data from Deutsche Asset & Wealth Management) The fund is weighted towards cyclical industries 47.45%, followed with cyclically sensitive industries at 23.66% and lastly, 16.83% are in defensive holdings. (Data from Deutsche Asset & Wealth Management) Of the 10 most heavily weighted companies, 66% are in cyclical industries, 21% are semi-cyclical and 13% are defensive. (Data from Deutsche Asset & Wealth Management) The leading fund holding is Toyota Motor Corp (NYSE: TM ) , at 6.16% of the fund, 28.166% of the top ten, and 27.668% of all the 58 Consumer Discretionary holdings. The second largest Consumer Discretionary in the top ten is also an auto manufacturer, Honda Motor (NYSE: HMC ) at 1.84%, accounting for 8.41% of the top ten and 8.264% of all consumer discretionary holdings. It’s important to note that the fund’s 10 motor vehicle manufactures add up to 10.425% of the net asset value. This means that 46.833% of the fund’s consumer discretionary holdings are auto manufacturers. Its then worth noting that automobiles and vehicle parts make up over 18% of Japanese exports. (click to enlarge) (Data from OEC) Lastly, almost 35% of Japan’s exports to the U.S. are autos and vehicle parts and just over 9% of the same to China. Hence a sizable portion of the fund is dependent on U.S. and Chinese automobile demand. The fund’s second heaviest weighted sector is financials at 19.64%, numbering 56 institutions. The largest in the top ten are Mitsubishi Financial (NYSE: MTU ) at 3.11%, Sumitomo Mitsui Financial (NYSE: SMFG ) at 1.91% and Mizuho Financial Group (NYSE: MFG ) at 1.65%. These three financials combined comprise 29.96% of the top ten holdings and 33.98% of all financial holdings. Once again, an important caveat needs to be stated here as well. Because of the Bank of Japan’s extraordinary QE policy, Japan’s banks are seeking higher yields overseas, and thus may be incurring higher risk. As noted in the Financial Times last April: … ultra-low BOJ interest rates are causing at Japan’s regional lenders, which have significant deposits but few lending opportunities because of their ageing local customer base…With 10-year JGB yields at 0.34 per cent, regional banks are investing in overseas sovereign debt or buying real estate funds in search of a yield pick-up.. The fourth largest sector is industrials at 19.48% of the fund. Within the top ten, one industrial, Fanuc LTD (FANUY ) , 1.49%, comprises 6.69% of the top ten and 7.649% of the fund’s 67 industrial holdings. Consumer Staples rank 5th at 6.67% and represented by Japan Tobacco ( OTCPK:JAPAY ) at 1.30%, 5.84% of the top ten and 19.23% of all consumer staples. Health Care follows at 6.30% represented by Takeda Pharmaceutical Co ( OTCPK:TKPYY ) at 1.25% of the top ten and 3.251% of all 21 Healthcare holdings. Lastly, Telecommunications is represented in the top ten by KDDI ( OTCPK:KDDIY ) , 1.29%; 5.79% of all top ten holdings and 62% of all telecom holdings. A trade profile of Japan reveals that, as noted, Autos are the lead export at 13%; Vehicle Parts, 5.3%; Integrated Circuits, 2.4%; Industrial Printers, 2.2% and Specialized Machinery, 1.7%. Of total exports to China, Integrated Circuits are 7.51%, followed by Vehicle Parts, 5.10% and Autos, 4.04%. Of total Japanese exports to U.S. Autos are 27.57% followed by Vehicle Parts, 7.40%; industrial Printers, 2.57%; Construction Vehicles, 2.41% and Aircraft Parts 2.33%. South Korea receives a sundry of intermediate industrial products, such as Hot Rolled Iron, 4.60; Raw Plastic Sheeting, 4.45% and Integrated Circuits, 3.90%. Exports to Thailand, a major Automobile manufacturing and assembly center, are Vehicle Parts, 11.59%; Engine Parts, 3.64% and Combustion engines, 2.22%, as well as intermediate iron. Lastly, according to the World Trade Organization, Japan accounts for 3.13% of Commercial Service exports and 3.70% of Commercial Service imports. Hence, automobiles, automobile components, heavy industrial machinery and construction equipment are important to Japan’s economy. Current Bank of Japan policy is maintaining a weaker Yen, with pressure mounting to stimulate the economy even more. This policy makes Japanese export products less expensive to the importers. Since the U.S. is a major importer of Japanese autos and heavy equipment, the Yen/Dollar hedge will offset the risk of a weakening Yen. Further, strengthening U.S. consumer spending bodes well for Japanese auto and electronics manufacturers. (click to enlarge) There are several USD/JPY hedged funds in this space. Based on the best one year returns of the top ten Japan focused funds, five are focused on a specific sector, two on subsets of the broader indices and the remaining three, including the X-Tracker fund are based on the broader indices. A summary comparison of the three broad based indices is presented in the table below. Fund/Inception Tracking Index 1 Year Return Total Assets Shares Outstanding Premium / Discount Distribution Yield Fees Recent Price P/E iShares Currency Hedged MSCI Japan ETF ( HEWJ) 1-31-14 MSCI 27.16% $830.7 million 26.4 million Discount at -0.08% 1.17% 0.48% after waiver $31.68 16.00 DBJP 6-9-11 MSCI 26.39% $1.358 billion 32.00 million Discount at -0.87% 1.74% 0.45% $42.03 17.00 WisdomTree Japan Hedged Equity ETF ( DXJ) 6-16-06 WisdomTree 25.04% $17 billion 314.6 million Discount at -0.49% 2.28% 0.48% $56.47 14.00 The fund is relatively new, having initiated trading in June of 2011. The market yield to date return is 16.42% and the trailing twelve month yield is 11.46% According to the prospectus , the fund is at least 80% invested and tracks the MSCI Japan U.S. Dollar Hedged Index, based on a subset of the Japanese Equity Market. There are 1,891 top tier companies and 3,486 in total in that index. Over the three years the fund has paid dividends totaling $6.55/share, the largest distribution, $3.42849, paid in December of 2014. The fund is currently trading at a slight discount to NAV at -0.87%. The extreme measures the BOJ needed to make weakened the currency considerably against the U.S. dollar. As it is now, it seems that the Yen will remain weak against the dollar for some time to come. Lastly, although the U.S. economy is growing it is doing so at a very moderate pace, whereas China’s rapid expansion seems to have come to a sudden halt, and might even be contracting. However, if indeed contracting, it offers Japan the opportunity to regain its status as the second largest global economy; an important point to consider. Disclosure: I/we have no positions in any stocks mentioned, and no plans to initiate any positions within the next 72 hours. (More…) I wrote this article myself, and it expresses my own opinions. I am not receiving compensation for it (other than from Seeking Alpha). I have no business relationship with any company whose stock is mentioned in this article. Additional disclosure: CFDs, spread betting and FX can result in losses exceeding your initial deposit. They are not suitable for everyone, so please ensure you understand the risks. Seek independent financial advice if necessary. Nothing in this article should be considered a personal recommendation. It does not account for your personal circumstances or appetite for risk.