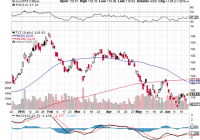
Summary DNP is a close-ended utilities fund in disguise. The interest rate spike of 2015 has hurt utilities, but DNP’s performance has remained strong. The current premium of DNP is at its highest level in the past two years. Introduction The start of 2015 has witnessed a mini “taper tantrum,” with treasury yields surging and bond funds such as the iShares 20+ Year Treasury Bond ETF (NYSEARCA: TLT ) falling over 10% from their highs. (click to enlarge) Equities considered to be interest-rate sensitive, such as REITs and utilities, have also been hit, with declines of -8.0% and -10.7% for Vanguard REIT ETF (NYSEARCA: VNQ ) and Utilities SPDR ETF (NYSEARCA: XLU ), respectively, since Feb. 1st, 2015. TLT Total Return Price data by YCharts Utilities CEFs Close-ended funds [CEFs] have a fixed amount of shares, meaning that their market prices can deviate significantly from their net asset values [NAVs]. This means that the market price of a CEF can exhibit periods of premium or discount to the NAV. Popular CEFs can display hefty premiums (e.g. PIMCO High Income Fund (NYSE: PHK )), while funds out of favor can exhibit tremendous discounts. An excellent summary of both domestic and global utilities CEFs can be found in Left Banker’s article here . The following chart shows the total return performance of four domestic utilities CEFs (defined as funds with > 85% North American exposure as viewed on Morningstar ) since Feb. 1st, 2015. ERH Total Return Price data by YCharts The three domestic utilities CEFs mentioned in Left Banker’s article have declined between -2.77% and -11.70% in price since Feb. 1st, 2015, with Gabelli Utility Trust (NYSE: GUT ) faring the best, Reaves Utility Income Fund (NYSEMKT: UTG ) in the middle, and Wells Fargo Advantage Utilities and High Income Fund (NYSEMKT: ERH ) performing the worst. Note that I have also included DNP Select Income Fund (NYSE: DNP ) in the chart. DNP has performed much better than the other three funds, with a total return performance of +2.98%. DNP Select Income Fund The DNP Select Income Fund, ticker symbol DNP, is a utilities CEF in disguise. DNP does not show up in a search for utilities CEFs on CEFConnect , instead, it is listed in the category of “US Equity-Growth & Income.” Moroever, there is nothing in the name of the fund to suggest that it is in fact a utilities fund. However, the mandate of DNP is clearly stated on the fund website : The Fund seeks to achieve its investment objectives by investing primarily in a diversified portfolio of equity and fixed income securities of companies in the public utilities industry. The Fund’s investment strategies have been developed to take advantage of the income and growth characteristics, and historical performances of securities of companies in the public utilities industry. Under normal conditions, more than 65% of the Fund’s total assets will be invested in securities of public utility companies engaged in the production, transmission or distribution of electric energy, gas or telephone services. The following chart shows the sector breakdown of DNP. As can be seen from the chart, the majority of the fund (72%) is invested in electric, gas and water utilities. Communications, and oil & gas storage, transportation and production both make up 13% of the fund each. 1% is in REITs and 1% is allocated to “other.” Therefore, it is my opinion that DNP is, for all intents and purposes, a utilities fund. It is currently unknown why DNP does not show up as a utilities fund on CEFConnect. It does own 15% in bonds, but so does ERH, which allocates nearly half of its holdings to bonds, preferred shares, and short-term debt. Finally, although the fund’s mandate allows it to invest up to 20% in foreign securities, its current international exposure is less than 2%. Increasing premium Was it the due to the lack of a “utilities” label that allowed DNP to escape the recent decline of utilities funds? That I cannot tell. However, what I can tell you is that since the start of the interest rate spike in February 2015, the NAV of DNP has been in decline while the market price has actually increased, as shown in the chart below. All of the following charts are from CEFConnect , unless stated otherwise. The consequence of this is the premium of DNP has soared to its present value of around 15%, its highest in a year. (click to enlarge) To be fair, DNP has reached even higher levels of premium in the past, with values of 40% being observed as recently as 2012. Still, the recent surge has produced a premium that is the highest over the past two years. (click to enlarge) The situation being observed for DNP, where the NAV declines but the market price remains steady, is reminiscent of what occurred for the Pioneer High Income Trust (NYSE: PHT ). I warned about PHT’s premium in a Jan. 23, 2015 article entitled ” I Would Avoid Pioneer High Income Trust At The Present Time “. While I did suggest the possibility of a distribution cut, I had no idea that it would happen so soon after my article. Unfortunately for PHT holders, the dividend cut caused a massive collapse in the share of PHT, even though the act of cutting the dividend theoretically has no impact on the value of the fund. This illustrates how incredibly sensitive premia and discount values can be to investors’ perception of the fund. (click to enlarge) The following table shows the Z-scores for DNP compared to the three other domestic utilities CEFs. The Z-score is a measure of the difference between the currently premium/discount relative to the historical premium/discount, normalized for standard deviation. We can see that DNP shows the largest Z-scores out of the four domestic utilities CEFs out of all five time periods. The 1-year Z-score of 2.55 indicates that statistically speaking, this deviation would be expected to occur less than 1% of the time. Z-Score (z D ) 3M 6M 1Y 2Y 4Y DNP 1.47 1.77 2.55 2.21 0.03 ERH -1.99 -2.25 -2.12 -2.17 -2.12 GUT -0.68 0.23 0.77 1.29 -0.15 UTG 0.53 -0.00 0.49 0.80 -0.51 The Z-scores for the funds are also presented graphically. While a distribution cut for DNP is probably not on the cards, it should still be noted that paid out small amounts of return-of-capital [ROC] for 6 of its last 12 distributions as shown on CEFConnect, and it also has a negative UNII of -$0.1663. GUT has made 12 out of 12 ROC distributions and also has a negative UNII of $-0.0019. ERH has no ROC distributions over the past 12 months and has a negative UNII of -$0.0727, while UTG also has no ROC distributions but has a positive UNII of $0.0079. Relevant data about the four funds are shown in the table below. Data are from CEFConnect . Fund Current premium/discount Yield Leverage Expense ratio DNP 14.3% 7.38% 26% 1.60% ERH -9.9% 7.75% 15% 1.08% GUT 25.0% 8.70% 17% 1.54% UTG 4.4% 6.14% 23% 1.71% Conclusion Like PHT, DNP is not a bad fund. It has a very long performance track record and has paid remarkably consistent distributions since inception in 1995. However, the market value of DNP has recently become disconnected from the fundamentals of the CEF, with share price increasing even though the NAV has declined by nearly 15% since the onset of the interest rate spike. Notably, DNP currently exhibits significantly larger Z-scores than the three other domestic utilities CEFs, indicating that it has become more expensive both relative to itself as well as relative to its peers. If I was a current holder of DNP, I would either hold or reduce my holdings, and I would certainly not add. More adventurous individuals may consider a pairs trading strategy by shorting DNP and going long XLU or another utilities fund (see my previous articles on examples of CEF pair trades that have returned over 20% annualized). Those with a bearish outlook on utilities might consider shorting DNP outright. The major risks of these strategies are that premium of DNP might continue to increase. Furthermore, those shorting DNP will have to pay both borrow costs and the cost of the covering the distribution. Disclosure: I am/we are short DNP. (More…) I wrote this article myself, and it expresses my own opinions. I am not receiving compensation for it (other than from Seeking Alpha). I have no business relationship with any company whose stock is mentioned in this article.