Tag Archives: alt-investing

GTAA Is For Real (Part 3): Why VBINX Is The Wrong Benchmark
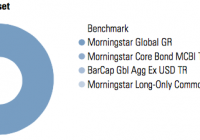
To judge a strategy, it is critically important to identify an appropriate benchmark. For several reasons, comparing tactical strategies to “balanced portfolios” like VBINX is inappropriate. The Global Market Portfolio meets all the criteria for a proper benchmark, making it is the most appropriate baseline for assessing GTAA strategies. At our research blog, we recently posted an article discussing how many noteworthy investment commentators either misunderstand or misconstrue the salient qualities of Tactical Asset Allocation strategies. We encourage you to read the entire piece, but today’s post will be limited to the topic of benchmarking. One of the most common failings of the investment industry is the prevalence of poorly specified benchmarks. This is of critical importance because it’s easy for a knowledgeable but disingenuous professional to manipulate the facts in order to make any point they want. Want a simple way to boost results? Choose an easy benchmark for comparison. Want to dismiss performance? Choose a challenging benchmark. Recall that at root, a well specified benchmark should meet the following criteria: It is passive; It is investible, and; It reflects the investing opportunity set of the manager. While all of these criteria are individually valid, they are unified by a simple and profound benchmarking philosophy: The best benchmark for a tactical manager is the one they would own if everyone were forced to invest all their assets in a single, passive portfolio. Axiomatically, this portfolio would represent the average positions of all market participants, and would hold each asset in a percentage equal to its proportion of total market capitalization. This is not a new concept; U.S. large cap equity managers are typically benchmarked against a market cap weighted index of large-cap U.S. stocks. U.S. Investment Grade bond managers are benchmarked against a market cap weighted index of U.S. listed investment grade bonds. Cap weighted indexes are common and intuitive when they are constructed within a major asset class. But it is not immediately intuitive how to extend the concept to multi-asset universes like those employed by GTAA managers. As a result, GTAA strategy benchmarks often seriously misrepresent the risks and opportunities of the underlying strategies. Investment commentators who dismiss TAA often compare the results of GTAA strategies to a U.S. 60/40 balanced fund like the Vanguard Balanced Index Fund (MUTF: VBINX ). And this benchmark does have one thing going for it, especially if a commentator’s goal is to malign GTAA strategies: it is a very tough benchmark to beat over the past one, three and five years – perhaps the toughest in the world in USD terms. Unfortunately, it’s hard to see how this portfolio represents an appropriate bogey for GTAA strategies over the long-term. For one, this portfolio is insulated from global currency effects, which have been especially pronounced in the past few years with global QE programs in effect. Second, it ignores non-U.S. equity beta; while a focus on U.S. equities at the expense of international stocks has been a lucky bet for the past few years, it ignores the broader scope of GTAA strategies. Also, since the goal of GTAA strategies is to harvest premia from as many liquid global sources as possible, the strategies often incorporate alternative investments, like REIT and commodity ETFs, into their investible universe. These are not represented in a U.S. balanced fund benchmark. Fortunately, some analysts take a more enlightened view. In their quarterly ” ETF Managed Portfolios Landscape Summary ” report, Morningstar proposes a much more globally diversified benchmark. The report’s Global All Asset benchmark, copied below, is composed of 55% global stocks, presumably distributed geographically by market cap; 35% global bonds, split evenly between U.S. and international; and 10% commodities. Source: Morningstar Clearly the folks at Morningstar are trying to be more representative of the GTAA space, and their mix is certainly in the right ballpark. But it is also still rather arbitrary – how did they arrive at their weights? Have they weighted toward historical GTAA holdings? If so, is there any guarantee that historical holdings will be representative of future holdings? These are dynamic strategies after all. Do commodities deserve a 10% strategic weighting or is this informed by recency bias? In addition, the Morningstar benchmark is over 80% weighted to U.S. dollars. Does this represent a neutral currency policy? We stated above that it isn’t immediately obvious how to extend the market cap weighted benchmarks applied to traditional single-asset portfolios, such as equity or bond funds, to a multi-asset context. This isn’t strictly true. In a multi-asset situation, we would expect a passive portfolio to hold all asset classes in proportion to their respective market capitalizations. Consider a simple example where the aggregate global market has a value of $100 trillion, where $50 trillion is stocks and $50 trillion is bonds. In this case, a passive investor would hold 50% of their portfolio in bonds and 50% in stocks. Every participant in the markets could hold this exact portfolio without changing the overall composition of the market, so it is the only passive, neutral portfolio. As discussed in prior posts (see here and here ) Doeswijk et. al. determined the actual market value of every global financial asset (as of year-end 2012) and published their relative market capitalization weights in a 2014 paper. These weights describe the most passive global portfolio possible: the global market cap weighted portfolio (GMP). This portfolio reflects the average portfolio positions of all investors globally. Fortunately, an investible version of this portfolio can be very closely replicated with low-cost, U.S. listed ETFs (see Figure 5.) This portfolio uniquely meets all the criteria for an appropriate benchmark: it is definitionally the only passive portfolio; it is definitionally investible; and it covers the investible opportunity set for GTAA mandates because it includes all global investible assets. Figure 5. Investible Global Market Portfolio. (click to enlarge) Source: Interpreted from Doeswijk et. al. We would note that the global market cap weighted portfolio definitionally holds all assets in their native currency, and therefore reflects currency fluctuations in non-domestic asset classes. Over 50% of both global equity and bond sleeves in our proposed global market portfolio is impacted by non-U.S. currency exposure (the foreign equity exposure is hidden inside our global equity ETF). We believe this is the most appropriate benchmark for GTAA strategies. In the next and final chapter of our series on GTAA, we will examine the performance of a robust cross-section of live strategies, and show how GTAA strategies have delivered measurable alpha against well specified benchmarks, even over this most difficult phase of the market cycle. Disclosure: I/we have no positions in any stocks mentioned, and no plans to initiate any positions within the next 72 hours. (More…) I wrote this article myself, and it expresses my own opinions. I am not receiving compensation for it. I have no business relationship with any company whose stock is mentioned in this article.
In A Rising Natural Gas Market Dynegy Is Worth Considering

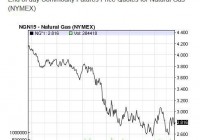
Summary DYN is an electricity generation company with coal fired power plants. The Utility sector is a very challenging space right now for a variety of reasons. Experts project a 19% upside at current price levels. Dynegy (NYSE: DYN ) is an electricity generation company whose generation portfolio is primarily coal fired power plants. The company is weathering a difficult business environment for Utilities. Coal fired plants cannot compete with natural gas fired plants at such low natural gas prices. However, if the price of natural gas rises to historical norms, then DYN’s coal fleet will see operating margins increase, which will have a positive impact on DYN’s stock value. Market Overview and Trends: The electricity market is going through a challenging period of government regulation, low electricity prices, increased churn and demand stagnation. The increasing concern for climate change has spurred a wave of regulation in the Utility sector. Not only are these regulations fluid and complex, they are expensive. Cross-State Air Pollution Rule , MATS , CO2 Emissions , and Byproducts, Wastes, Hazardous Materials and Contamination, just to name a few. The price for electricity is set by baseload generation facilities which are natural gas fueled Combined Cycle Gas Turbines (CCGTs) which historically have had lower operating margins than coal fueled facilities, but with natural gas prices at near historic lows, CCGTs produce power at lower prices than coal. When CCGTs produce at a lower price than coal, coal facilities stop producing and start losing money. Innovations in how consumers measure and exchange electricity have become much more sophisticated over the last 20 years. For example, in the ERCOT market, people have the ability to switch retail providers instantly through the Internet. It has never been easier for a retail customer or business customer to switch providers, because of this, the industry is experiencing increased rates of customer churn. Energy efficiency across many levels of society have caused the general demand for electricity to grow at slower rates than ever before. People use more electricity than ever, but increases in efficiency have caused the growth rate for the electricity market as a whole to slow. * from the NASDAQ Business Positioning and Summary: Dynegy is primarily an electricity generation company. The company’s fleet consists of 15 power plants in five states. All nine of Dynegy’s baseload generation plants are coal and are located in the state of Illinois. The lion’s share of the other generation facilities are fueled by natural gas. As a final point, it is worth noting that DYN does not provide dividends. (click to enlarge) * from the 10-k Growth Strategy: from the 10-k Customer Focus: DYN’s commercial strategy seeks to lock in near-term cash flows while preserving the ability to capture higher values long-term as power markets improve. Further the company reduces market risk by linking generation directly to customer load which reduces the need to hedge. In the wholesale and retail spaces DYN plans little change. Continuous Improvement: The company has invested approximately $1 billion towards ensuring their facilities are safe, reliable, cost-efficient and environmentally compliant. The company also continues to employ their three year cost and performance improvement initiative, also known as PRIDE, which is expected to finish a year ahead of schedule. PRIDE’s targets were $135 million in operation improvements and $165 million in balance sheet efficiencies. Capital Allocation: The company’s foremost capital allocation strategy is to maintain an appropriate leverage and liquidity profile and to make the necessary capital investments to maintain the safety, compliance and reliability of our fleet. Additionally the company plans to expand their first lien collateral program to include additional hedging counterparties and lines of credit. Risk Management: Competition: There is increasing regional competition in the power markets due to an increase in the penetration and economic viability of distributed and renewable energy sources. The company plans to stay competitive by maintaining a low cost of production through managed fuel costs and reliability. Further the ability to compete effectively will be impacted by regulatory reforms designed to reduce GHG emissions. Current and Future Government Regulation: DYN is subject to a myriad of government regulations and environmental laws. The legal landscape is complex and ever changing and DYN will have to stay up to code on all of these issues. Here is a list of the major issues which impact DYN: The Clean Air Act, Cross-State Air Pollution Rule, MATS rule, NAAQS, The Clean Water Act, Coal Combustion Residuals, Climate Change. Market Liquidity and Counterparty Risk: The company transacts hedges in the Natural Gas, Coal and Power markets. If any of the counterparties experience deteriorating credit, then DYN’s hedges may not be honored. This would adversely impact the company. DYN tries to manage this risk by only transacting hedges with highly liquid counterparties and also by diversifying hedges across many different counterparties. Natural Gas Market Exposure: DYN purchases fuel for its Natural Gas power generation facilities under short-term contracts or on the spot market. As a result the company faces the risks of supply interruptions and fuel price volatility. Further profitable operation of the company’s coal-fired generation facilities is dependent upon coal prices and coal transportation rates. The company tries to mitigate these risks by entering into long-term transportation and supply contracts. Expert Opinion: (click to enlarge) * from Yahoo Finance The experts following DYN have moved from bearish sentiments in 2010-2012, to bullish in 2013-2015. Analysts have a median price target of $39.50 per share which gives the company a 19.33% upside at the current price of $33.31 per share. * from Yahoo Finance Analysts project DYN revenues to grow 22.1% between 2015 and 2016. Further the company has shown extremely strong sales growth of 86.7% and 158.3% year-over-year for the current quarter and the quarter ending Sept. 15th, respectively. Out of context the sales numbers look extremely bullish, however, they are more inline with expected levels and DYN had a poor year last year. Recent News: Dynegy Amends Employment Agreement with CEO Robert Flexon Dynegy Completes Duke Midwest Acquisition ; Transformational Growth for company Dynegy Completes EquiPower and Brayton Point Acquisitions from Energy Capital Partners C onclusion : Dynegy is an electricity generation company which derives much of its revenues from coal fired generation. Coal fired generation margins increase as the price of natural gas increases. I would recommend Dynegy to an investor looking for a very specific type of risk exposure. The investor needs to be looking for an asset that produces a predictable valuation, has less volatility in value than the general market and wants to gain from an increase in natural gas prices. Currently the beta of DYN is 0.11, which means that movement of DYN’s stock is relatively independent to the movements of the market at large. Further, natural gas prices have moved whip-saw market with a high bound of $3.1 and a low of $2.60 since the beginning of 2015. Additionally the experts see a 19% upside with DYN’s current stock price. So, if you find that you are an investor who wishes to gain an indirect and conservative exposure to a rising natural gas market, consider DYN. Disclosure: I/we have no positions in any stocks mentioned, and no plans to initiate any positions within the next 72 hours. (More…) I wrote this article myself, and it expresses my own opinions. I am not receiving compensation for it (other than from Seeking Alpha). I have no business relationship with any company whose stock is mentioned in this article.

Review Of 10 Themes Shaping Markets In 2015

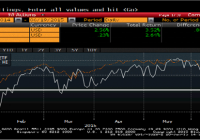
Summary Semi-annually, I list my unfiltered investment themes and determine if I should tilt my asset allocation. This article is a review of my themes from the beginning of 2015 and a preview of my themes for the back half of the year. This process still leaves me with a muted tone for domestic assets and wary of increasing volatility. In early January, I wrote an article laying out my ” Ten Themes Shaping Markets in 2015 “. Stepping back from the day-to-day volatility of the market and writing down your own investment themes can be a valuable tool to framing your market expectations and setting your tactical asset allocation. As I began to write a semi-annual refresh of my market themes, I wanted to first revisit the market premises underpinning my positioning at the beginning of 2015. I hope that this retrospective look back at my beginning of year themes, and why my prognostications have or have not come to fruition, can be introspective to portfolio positioning for the remainder of the year. In bold, I have listed my beginning of year themes. Below these ten items, I discuss my view of how these themes have played out in the first half of 2015. 1. Deviating economic growth rates globally and attendant diverging paths of monetary policy will create new global imbalances, creating volatility and investment opportunity. In a global financial system that has become more linked over time, a failure for rates and currencies to converge in the short-run could lead to greater imbalances over longer time periods. As the U.S. mortgage crisis begat a global financial crisis which in turn exacerbated a European sovereign debt crisis, we have seen volatility cascade around the world. It is no wonder that the International Monetary Fund and World Bank have asked the Federal Reserve to forestall rate increases. The Fed, which has a dual mandate for maximum employment and stable prices in the United States , is being asked to be mindful of the global impact of its policies. This theme will be unchanged in my second half view, and could stay with financial markets for some time. 2. Financial market volatility has been at an unnatural trough. Sustained economic growth would lead to reduced monetary accommodation, precipitating volatility as interest rates climb. Conversely, weakened economic growth could lead to a sharp re-pricing of risky asset classes. In the first half, we saw weakened domestic economic growth and higher interest rates. While domestic economic growth contracted modestly in the first quarter, the market viewed the lull as driven by temporal factors like unseasonably cold weather and the sharp fall in oil prices on investment without a direct offset in higher consumption. Through the first half, we have managed to stay in this Goldilocks period of growth that is neither too fast to force the removal of Fed support nor too slow to lead to force a re-pricing of securities. Eventually the porridge will become too hot or too cold. 3. Global inflationary pressures remain quite subdued as witnessed in commodity prices, providing ballast for long interest rates. Disinflation risks remain in Europe and Japan. Falling domestic unemployment will continue to be slow to translate into wage growth in the United States given a generationally low labor force participation rate. While oil prices have rebounded since the beginning of the year (+9-11%), base metals have continued to move lower, a sign of sluggish global demand. Inflation readings in Europe and Japan, while positive, continue to be paltry at +0.3%. While the headline unemployment rate (5.5%) is approaching the estimated natural rate of unemployment, the labor force participation rate (62.9%) is still 3.5% below its peak in early 2007, equivalent to nearly 9 million of missing jobs. Inflation fears remain muted. 4. While the Federal Reserve is likely to raise the Federal Funds rate in the back half of 2015, the unwind of monetary accommodation will continue at a measured and data-dependent pace given little headroom for incremental support if the economy suffers an exogenous shock from foreign markets. The June FOMC statement was released last Wednesday, and the committee upgraded its assessment of economic activity, describing it as “having expanded moderately” versus having “slowed” in the April statement. Job growth was characterized by a “diminishing underutilization of labor market resources.” While the committee was more constructive on economic growth in its statement, the committee members view of the path of monetary policy as expressed through the oft discussed “dot plot” showed median expectations that flattened, with Fed Funds projections falling by 25bp on average for year-end 2016 and 2017 to 1.625% and 2.875% respectively. The qualitative discussion of an improvement in the economy and labor markets was met with quantitative depictions of a slower path of monetary policy normalization, signaling the Fed will remain data dependent on both the timing of the first interest rate hike and the pace of subsequent tightening. We are approaching the nine-year anniversary of the last Federal Reserve rate hike on June 29, 2006 when the Federal Reserve boosted its target Federal Funds rate 0.25% to 5.25%. In the lead up to the recent Federal Open Market Committee (FOMC) meeting, the market had begun to increasingly price in a September rate increase. Those odds have diminished somewhat as the market took the Fed’s commentary as generally bullish for rates. I continue to believe we will move off of the zero bound at the December meeting, and believe that the market’s attention should turn from the timing of the first rate increase to the pace of future rate increases, which I expect to continue to be slower than the current Fed expectations. 5. Stretched equity multiples domestically will necessitate that valuations be driven by changes in earnings, tempering further price gains. Speculative grade credit may offer better risk-adjusted returns than domestic equities. One of my principal takeaways from my January themes were that forward domestic assets returns were likely to be subdued. With my expectation for the central tendency of domestic equity returns to be in the high single digits, high yield bond returns, which I expected to be in the 6%-7% range after the oil-driven selloff in late 2014, looked good on a relative basis. While the strong equity market performance and recent fixed income sell-off have put domestic equity returns in front of the high yield bond market, the path has been smoother for junk bonds than domestic equities. Below is a graph comparing the year-to-date cumulative total return of the S&P 500 ETF (NYSEARCA: SPY ) versus the SPDR Barclays High Yield Bond ETF (NYSEARCA: JNK ), demonstrating how this theme has played out in 2015. (click to enlarge) Sources: Bloomberg, Standard and Poor’s 6. Lagging returns for risky assets in Europe post-crisis and the likelihood of an increase in quantitative easing could lead to absolute outperformance relative to the U.S., but the variability of outcomes abroad is much wider. Given lower equity multiples and more accommodative monetary policy in Europe than the United States, higher return expectations abroad appear warranted. As the escalating Greek drama has highlighted, the European experiment has challenges unique to the United States. Europe has posted much higher equity returns thus far in 2015… (click to enlarge) Sources: Bloomberg, Standard and Poor’s …but when translated into U.S. dollars, the outperformance has been much less material. (click to enlarge) Sources: Bloomberg, Standard and Poor’s 7. This comparison extends to emerging markets, which could benefit most directly from rebounding economic growth, but remain exposed to global fund flows and the higher beta nature of their commodity-intensive economies. Emerging markets had outperformed for most of the year until the recent swoon. EM stocks have fallen by ten percent in just the last six weeks. (click to enlarge) Sources: Bloomberg, Standard and Poor’s 8. Within emerging markets, return dispersion will widen and could be defined by a given locale’s level of political unrest, fiscal or current account deficit, or exposure to commodities or a slowing China. A surprise uptick in global growth would make most markets winners, but there are many paths to another year of lackluster returns. We have seen historically strong returns from the Shenzen Composite Index (+93%), but negative returns in other Asian economies tied strongly to the Chinese economy. 9. Rising income and wealth inequality, excess global savings, and demography are combining to disrupt normal cyclical demand growth and increasing the risk of secular stagnation. Inequality will become a thematic constant that will inform global politics and policy. Like the first theme on global imbalances, socioeconomic imbalances are likely to remain a continued theme in financial markets and impact politics. 10. With stock prices near all-time highs and bond prices boosted by low interest rates, forward returns will be subnormal. As we head later into the business cycle, investors may wish to move towards a more defensive posturing, lower volatility investments, or look to lock-in cheap tail risk hedges. Domestic equity markets have squeezed out modestly positive returns in the first half, but the expectation for subnormal forward returns remains. While investors have unique time horizons, risk profiles, and risk tolerances, an honest discussion of their personal investment themes should be used to frame their tactical asset allocation. From this review of these first half themes, I expect to publish my themes for the second half in the near-term. I welcome feedback as I sharpen my themes for the second half of 2015. Author’s Disclosure My articles may contain statements and projections that are forward-looking in nature, and therefore inherently subject to numerous risks, uncertainties and assumptions. While my articles focus on generating long-term risk-adjusted returns, investment decisions necessarily involve the risk of loss of principal. Individual investor circumstances vary significantly, and information gleaned from my articles should be applied to your own unique investment situation, objectives, risk tolerance, and investment horizon. Disclosure: I am/we are long SPY. (More…) I wrote this article myself, and it expresses my own opinions. I am not receiving compensation for it (other than from Seeking Alpha). I have no business relationship with any company whose stock is mentioned in this article.