Tag Archives: alt-investing

Should You Make Chemical Enhancements To Your Portfolio?

By Todd Rosenbluth Most diversified index-based materials products have significant exposure to the chemicals industry, though the weightings can be different. For example, chemicals comprised approximately 70% of the S&P 500 Materials Index as of late June. Meanwhile, the S&P 500 Equal Weight Materials index had a 54% weighting in chemicals, with more exposure in containers & packaging companies. As such we think investors need to understand what drives the industry. S&P Capital IQ thinks cost saving efforts can spur the chemicals industry to higher earnings per share (EPS) growth levels in 2016, after expected growth of less than 10% in 2015. We see industry revenues growing slightly and at a slower pace over the next few years. Our profit and revenue growth forecasts are tied to the likelihood of a steadily improving U.S. macroeconomic environment, mostly offset by a stronger U.S. dollar, significantly lower oil prices, and slowing economic growth in China. The chemicals industry is comprised of five sub-industries: specialty chemicals, diversified chemicals, fertilizer & agricultural chemicals, industrial gases, and commodity chemicals. According to S&P Capital IQ equity analyst Christopher Muir, revenues of specialty chemicals companies are mostly influenced by volumes, while commodity chemicals companies face significant threats to revenue per share from changes in commodity prices for their products or raw materials. For fertilizer & agricultural chemicals companies, prices of the products will likely affect fertilizer revenue per share, while agricultural chemicals, including specialty seeds, are more-specialized products, which are driven by volumes. Industrial gas companies are likely to see a mix of volumes and prices driving revenues. In the fourth quarter of 2014 and first quarter of 2015, a rise in the value of the dollar versus other currencies had a negative effect on revenue per share, but a fall in the dollar index would be a positive in the second half of 2015 and in 2016. Specialty chemicals companies and divisions spend money and time developing new products. In most cases, Muir noted these new products are highly specialized to suit the end user, and as a result are often sold at much higher margins than their less specialized counterparts are, helping operating margin. S&P Capital IQ recently published an Industry Survey that reviews the drivers of the chemicals industry. This report along with S&P Capital IQ stock and ETF reports tied to materials sector can be found on MarketScope Advisor. Disclosure: © S&P Dow Jones Indices LLC 2015. Indexology® is a trademark of S&P Dow Jones Indices LLC (SPDJI). S&P® is a trademark of Standard & Poor’s Financial Services LLC and Dow Jones® is a trademark of Dow Jones Trademark Holdings LLC, and those marks have been licensed to S&P DJI. This material is reproduced with the prior written consent of S&P DJI. For more information on S&P DJI and to see our full disclaimer, visit www.spdji.com/terms-of-use .
Tactical Asset Allocation – July 2015 Update

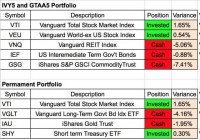
“}); $$(‘#article_top_info .info_content div’)[0].insert({bottom: $(‘mover’)}); } $(‘article_top_info’).addClassName(test_version); } SeekingAlpha.Initializer.onDOMLoad(function(){ setEvents();}); Here are the tactical asset allocation updates for July 2015. All portfolio updates are online as part of Paul’s GTAA 13 Portfolio New sheet. First, for the basic portfolios – the GTAA5 and the Permanent Portfolio. There was one change in the GTAA5 portfolio. Bonds (via the iShares 7-10 Year Treasury Bond ETF (NYSEARCA: IEF )) went to cash this month. GTAA5 is now 40% invested and 60% cash. For the timing version of the Permanent Portfolio there were no changes this month. The TAA version of the Permanent Portfolio is 50% invested and 50% in cash just like last month. Now for the more aggressive GTAA AGG3 and AGG6 portfolios. There is one change for AGG3 this month. The Vanguard Value ETF (NYSEARCA: VTV ) has replaced the Vanguard Small Cap Value ETF (NYSEARCA: VBR ) in the top 3 although not by much. For AGG6, there is no change this month. While the Vanguard Intermediate-Term Government Bond Index ETF (NASDAQ: VGIT ) replaced the Vanguard Long-Term Government Bond Index ETF (NASDAQ: VGLT ) in the top 6, VGIT is below its 200 day SMA and thus there in no investment in the ETF. AGG6 like last month only has 5 holdings for July. Performance for the portfolios so far this year is in the table below. Numbers are for each month. The figures are estimates taken from a variety of sources. I don’t do detailed performance tracking until the end of the year. (click to enlarge) If you’re a fan of the Antonacci dual momentum GEM and GBM portfolios, GEM continues to be invested in U.S. stocks (via the Vanguard Total Stock Market ETF (NYSEARCA: VTI ) ), and the bond momentum option of the GBM portfolio continues to be invested in U.S. long term gov’t bonds (via the Vanguard Long-Term Government Bond Index ETF ( VGLT )). No changes from last month. That’s it for this month. These portfolios signals are valid for the whole month of July. As always, post any questions you have in the comments. Share this article with a colleague

Ivy Portfolio July Update

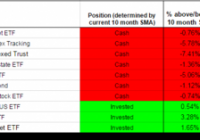
The Ivy Portfolio spreadsheet track the 10 month moving average signals for two portfolios listed in Mebane Faber’s book The Ivy Portfolio: How to Invest Like the Top Endowments and Avoid Bear Markets . Faber discusses 5, 10, and 20 security portfolios that have trading signals based on long-term moving averages. The Ivy Portfolio spreadsheet tracks both the 5 and 10 ETF Portfolios listed in Faber’s book. When a security is trading below its 10 month simple moving average, the position is listed as “Cash”. When the security is trading above its 10 month simple moving average the positions is listed as “Invested”. The spreadsheet’s signals update once daily (typically in the late evening) using dividend/split adjusted closing price from Yahoo Finance. The 10 month simple moving average is based on the most recent 10 months including the current month’s most recent daily closing price. Even though the signals update daily, it is not an endorsement to check signals daily or trade based on daily updates. It simply gives the spreadsheet more versatility for users to check at his or her leisure. The page also displays the percentage each ETF within the Ivy 10 and Ivy 5 Portfolio is above or below the current 10 month simple moving average, using both adjusted and unadjusted data. If an ETF has paid a dividend or split within the past 10 months, then when comparing the adjusted/unadjusted data you will see differences in the percent an ETF is above/below the 10 month SMA. This could also potentially impact whether an ETF is above or below its 10 month SMA. Regardless of whether you prefer the adjusted or unadjusted data, it is important to remain consistent in your approach. My preference is to use adjusted data when evaluating signals. The current signals based on June 30th’s adjusted closing prices are below. As of the close May 29, the PowerShares DB Commodity Index Tracking ETF (NYSEARCA: DBC ) , the iShares S&P GSCI Commodity-Indexed Trust ETF (NYSEARCA: GSG ), the Vanguard REIT Index ETF (NYSEARCA: VNQ ) and the iShares TIPS Bond ETF (NYSEARCA: TIP ) were below their 10 month moving average. This month those 4 ETFs remain below their moving average. In addition, the Vanguard Total Bond Market ETF (NYSEARCA: BND ), the SPDR Dow Jones International Real Estate ETF (NYSEARCA: RWX ), TIP and the Vanguard FTSE Emerging Markets ETF (VWO ) are now also below their 10 month moving average. The spreadsheet also provides quarterly, half year, and yearly return data courtesy of Finviz . The return data is useful for those interested in overlaying a momentum strategy with the 10 month SMA strategy: (click to enlarge) (click to enlarge) I also provide a “Commission-Free” Ivy Portfolio spreadsheet as an added bonus. This document tracks the 10 month moving averages for four different portfolios designed for TD Ameritrade, Fidelity, Charles Schwab, and Vanguard commission-free ETF offers. Not all ETFs in each portfolio are commission free, as each broker limits the selection of commission-free ETFs and viable ETFs may not exist in each asset class. Other restrictions and limitations may apply depending on each broker. Below are the 10 month moving average signals (using adjusted price data) for the commission-free portfolios: (click to enlarge) (click to enlarge) Disclosures: None