Tag Archives: alt-investing

The Right Municipal Bond ETF Right Now
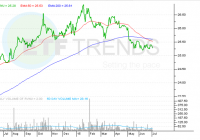
Summary Puerto Rico problems raises concerns in municipal bond space. Take a look at a more conservative muni ETF that targets debt from dedicated revenue streams. Highlight of the Deutsche X-trackers Municipal Infrastructure Revenue Bond ETF. By Todd Shriber & Tom Lydon Chicago. Detroit. Puerto Rico. Increasingly precarious financial positions in those cities and territories and others across the U.S. have cast a pall over the municipal bond market. The cases of Chicago, Detroit and other cities across the U.S., including several mid-sized cities in California, underscore the pressure public pensions and post-employment benefits, such as healthcare for public workers, are putting on state and municipal finances. Those weakening financial positions are prompting advisors and investors to consider alternatives to general obligation bonds when building out the municipal section of fixed income portfolios. There is an exchange traded fund for that and that fund is the Deutsche X-Trackers Municipal Infrastructure Revenue Bond Fund (NYSEArca: RVNU ) . RVNU seeks to limit or reduce exposure to public pension risk, not avoid or eliminate it, by focusing solely on bonds that fund, state and local infrastructure projects such as water and sewer systems, public power systems, toll roads, bridges, tunnels, and many other public use projects where the interest and principal repayments are generated from dedicated revenue sources. Toll roads, tunnels and water systems may not sound like the sexiest investment themes, but with public pension issues afflicting states from New Jersey to Pennsylvania to California, revenue bonds, including those held by RVNU, can be seen as the “new black” of the municipal bond market. “RVNU allows us to offer a product that focuses on investment-grade revenue bonds,” said Deutsche Asset & Wealth Management (Deutsche AWM) Portfolio Manager Blair Ridley in an interview with ETF Trends. “We focus on revenue issuers that by that heir nature usually carry less pension risk as compared to general obligation issuers. We’re trying to follow those issues with dedicated revenue streams, or ‘essential purpose bonds. In any economic environment, people will pay their electric bill and their water bill.” RVNU’s index is intended to track federal tax-exempt municipal bonds that have been issued with the intention of funding, state and local infrastructure projects such as water and sewer systems, public power systems, toll roads, bridges, tunnels, and many other public use projects. The index will attempt to only hold those bonds issued by state and local municipalities where the interest and principal repayments are generated from dedicated revenue sources. A succinct way of highlighting RVNU’s utility in the current municipal bond market environment comes courtesy of Deutsche AWM portfolio manager Ashton Goodfield. She said, “RVNU has less exposure to headline risk. The revenue streams are more stable in up and down economic environments. These revenue streams are what pays back principal and interest on the bonds.” RVNU is just over two years old holds 44 bonds. The ETF’s underlying index, the DBIQ Municipal Infrastructure Revenue Bond Index, holds over 800 bonds. As Ridley notes, RVNU has “a lot of room to add holdings.” RVNU employs a representative sampling methodology in order to match the traits and returns of its underlying index. RVNU has the flexibility to go as far down the ratings spectrum as BBB, but bonds rated either AA or A currently comprise over 86% of RVNU’s index, according to issuer data. At a time of heightened concerns regarding bond liquidity, RVNU ensures liquidity by tilting more than 75% of the fund’s lineup to issues with $100 million or more outstanding. Another obvious concern is rising interest rates and how higher rates will affect longer duration bond funds. RVNU’s index has a modified duration of 6.53 years. That longer duration has been something of a hurdle for RVNU, but one the ETF can easily overcome. “Our focus is on finding the most attractive part of the yield curve,” adds Ridley. “RVNU finds bonds with 10-year calls because those have the same sensitivity as bonds with 10-year maturities.” Since coming to market, RVNU has taken its lumps. The ETF debuted in the midst of the 2013 taper tantrum and the Detroit bankruptcy, but at a time when some of the largest U.S. states, including California and Illinois, are awash in massively under-funded public employee pension obligations, some investors are looking to diversify away from GO bonds while still keeping exposure to munis. “Clients are asking about GOs and pensions,” said Goodfield. “There are some municipalities that aren’t managing these issues well. While true, we think it’s important to say many general obligation issuers are managing these issues well Some investors have a negative outlook and want to be solely in revenue bonds.” As Goodfield notes, awareness of public pension issues is on the rise. That could prove to be good for RVNU over the long-term. Deutsche X-Trackers Municipal Infrastructure Revenue Bond Fund (click to enlarge) Tom Lydon’s clients own shares of RVNU. Disclosure: I/we have no positions in any stocks mentioned, and no plans to initiate any positions within the next 72 hours. (More…) I wrote this article myself, and it expresses my own opinions. I am not receiving compensation for it. I have no business relationship with any company whose stock is mentioned in this article.
5 Ways To Beat The Market: Part II Revisited

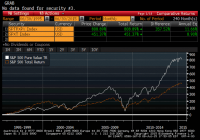
In a series of articles in December 2014, I highlighted five buy-and-hold strategies that have historically outperformed the S&P 500 (SPY). Stock ownership by U.S. households is low and falling even as the barriers to entering the market have been greatly reduced. Investors should understand simple and easy to implement strategies that have been shown to outperform the market over long time intervals. The second of five strategies I will revisit in this series of articles is the “value factor” that has seen stocks with these characteristics outperform the broader market. In a series of articles in December 2014, I demonstrated five buy-and-hold strategies – size, value, low volatility, dividend growth, and equal weighting, that have historically outperformed the S&P 500 (NYSEARCA: SPY ). I covered an update to the size factor published on Wednesday. In that series, I demonstrated that while technological barriers and costs to market access have been falling, the number of households that own stocks in non-retirement accounts has been falling as well. Less that 14% of U.S. households directly own stocks, which is less than half of the amount of households that own dogs or cats , and less than half of the proportion of households that own guns . The percentage of households that directly own stocks is even less than the percentage of households that have Netflix or Hulu . The strategies I discussed in this series are low cost ways of getting broadly diversified domestic equity exposure with factor tilts that have generated long-run structural alpha. I want to keep these investor topics in front of the Seeking Alpha readership, so I will re-visit these principles with a discussion of the first half returns of these strategies in a series of five articles over the next five days. Reprisals of these articles will allow me to continually update the long-run returns of these strategies for the readership. Value In the first article in this series, I described the “size factor”, or why small-cap stocks tend to outperform large-cap stocks over long time intervals. The size factor is captured in the Fama-French Three Factor Model that helped earn Eugene Fama the Nobel Prize in Economics in 2013. Another of these factors is the “value factor.” The researchers noted that low market-to-book stocks tended to outperform high market-book stocks. Adding the “size factor” and value factor” to the Capital Asset Pricing Model better describes the stock market performance than beta alone. Since we are trying to beat the general market, it makes intuitive sense that alpha would be found in a value factor that was used as a supplement to better describe overall returns. Our second way to beat the market, as proxied by the S&P 500, is then to simply buy value stocks. Below I have tabled the average returns of the S&P 500 Pure Value Index, and show the returns of this index graphed against the S&P 500. For more information on this style-concentrated index, please see the linked microsite . This index is replicated through the Guggenheim S&P 500 Pure Value ETF (NYSEARCA: RPV ) with an expense ratio of 0.35%. The S&P 500 Pure Value Index identifies constituents by measures of high levels of book value, earnings, and sales to the share price. In the five strategies I am detailing to “beat the market”, I will be using trailing 20 years of data, which is the longest time interval that encapsulated all of the relevant indices used in the analysis. (click to enlarge) Source: Bloomberg; Standard and Poor’s Source: Bloomberg; Standard and Poor’s Why has value investing worked historically? Why has the S&P 500 Pure Value Index outperformed over this long sample period? Value investing has been extolled since the days of Benjamin Graham, and put into most visible practice by his pupil, Warren Buffett. Value investing necessitates understanding the difference between a stock that is valued too low by the market, and a stock that is a “value trap” because changes in the business or its industry have created a structural headwind. Value investors then need to have the fortitude to hold their investment when investor sentiment runs counter to their investment themes. On average, individual investors do not have these attributes. In data from “How America Saves”, the fund giant Vanguard has published a wealth of data on defined contribution plans under its management. The table below shows participant contributions in Vanguard’s defined contribution plans over the trailing ten years. Investors should on average be taking a long-term view towards their retirement assets; however, investors owned their lowest percentage of equities in 2009 as markets rebounded from the 2008 downturn, missing a 26.5% total return for the S&P 500 and a tremendous 55.2% return for the S&P 500 Pure Value Index. Source: Vanguard – an updated version of their analysis is linked . In the four years that the S&P 500 produced a negative return in our twenty-year dataset, the value index produced a higher return in the following year. In the Vanguard data, retirement plan participants, who should be taking a long-term view towards their investments, were less likely to own equities after 2008. Value investing is a discipline, and the average investor is not suited to follow this approach, which may be why a low-cost, rules-based exchange-traded fund with a value bent like may be a good solution for some investors. While a value-based strategy has historically outperformed, you can see from the data table below that the value-based index lagged in the first half of 2015. Source: Bloomberg, Standard and Poor’s This 249bp first half underperformance relative to the S&P 500 was the last first half underperformance since 2012. In that year, value stocks rebounded by generating a nearly 18% return in the second half versus a 6% return for the broader market. Value stocks have only produced negative returns over the first six months of four calendar years in the dataset, 1994, 2000, 2008, and 2015. Two of those periods (2000 and 2008) preceded economic recessions and one year 1994 – featured sharply higher interest rates. As I wrote in my 10 Themes Shaping Markets in the Back Half of 2015 , with stock prices near all-time highs and bond prices still elevated from low interest rates despite the first half sell-off, forward returns in asset markets will continue to be subnormal. For long-term investors with a buy-and-hold approach, the value factor has generated alpha over long-time intervals. I will be publishing updated results for three additional proven buy-and-hold strategies that can be replicated through low cost indices over the next three days. Disclaimer My articles may contain statements and projections that are forward-looking in nature, and therefore inherently subject to numerous risks, uncertainties and assumptions. While my articles focus on generating long-term risk-adjusted returns, investment decisions necessarily involve the risk of loss of principal. Individual investor circumstances vary significantly, and information gleaned from my articles should be applied to your own unique investment situation, objectives, risk tolerance, and investment horizon. Disclosure: I am/we are long SPY. (More…) I wrote this article myself, and it expresses my own opinions. I am not receiving compensation for it (other than from Seeking Alpha). I have no business relationship with any company whose stock is mentioned in this article.

Inside The Crash In China ETFs

China was hot and soaring among all stock markets across the globe for the most of this year thanks to rounds of ultra-easing policies. In fact, China was leading the global markets, attaining the best performing country spot for the first half. But the incredible run was washed away over the past few weeks as concerns brew over the longevity of the stimulus-driven rally and the real health of the economy. Further, worries over lofty valuations raised a panic alarm among investors after a one-year stupendous rally. What Let the Dragon Out Several factors led to horrendous trading in China. First, more than 40% of the mainland China companies halted trading in their shares, locking in up $2.6 trillion worth of shares. This is touted to be the largest wave of trading halts in the history of the Chinese equity market. Additionally, the world’s second largest economy is faltering with slower growth in six years, credit crunch, a property market slump, weak domestic demand, lower industrial production, and lower factory output. Corporate profits are also lower than a year ago. Further, a slew of recent measures including fresh interest-rate cuts, stock purchases by state-directed funds, looser margin-financing rules, central bank pledge of liquidity support, and suspension of new listings are not helping in any way to boost investors’ confidence. Lastly, deepening Greece crisis and Grexit fears shook investors across the globe, a creating risk-off trading environment. The combination of factors led to a dragonish sell-off in the Chinese market. The Shanghai Composite Index plunged over 8% in today’s session, extending its steepest three-week decline since 1992. With this, the index tumbled 32% since its peak in June 12 and wiped out more than $3.5 trillion in market capitalization. On the other hand, Hong Kong’s Hang Seng Index plunged as much as 8.6% on the day, making the biggest drop since November 2008. ETF Impact Quite expectedly, the terrible trading has been felt in the Chinese ETF world too. Funds in this space also saw big losses over the past one month, putting an end to their winning streaks, and landing them in the bear territory. China ETFs Performance Market Vectors China SME-ChiNext ETF (NYSEARCA: CNXT ) -43.54% db X-trackers Harvest CSI 500 China-A Shares Small Cap Fund (NYSEARCA: ASHS ) -43.49% iShares MSCI China Small-Cap ETF (NYSEARCA: ECNS ) -29.14% Guggenheim China Small Cap ETF (NYSEARCA: HAO ) -25.24% First Trust China AlphaDEX Fund (NYSEARCA: FCA ) -17.27% SPDR S&P China ETF (NYSEARCA: GXC ) -16.38% iShares FTSE China ETF (NASDAQ: FCHI ) -16.14% iShares MSCI China Index Fund (NYSEARCA: MCHI ) -15.57% iShares China Large-Cap ETF (NYSEARCA: FXI ) -15.08% PowerShares Golden Dragon China Portfolio (NYSEARCA: PGJ ) -13.92% From the above table, it should be noted that steep declines were widespread among the Chinese ETFs. Interestingly, A-shares ETFs have been the worst performers of the Chinese rout, followed by small caps. Large-cap focused funds and the broad market funds too saw double-digit declines over the past four weeks. Further, ETFs targeting specific sectors like Global X China Industrials ETF (NYSEARCA: CHII ), Global X China Materials ETF (NYSEARCA: CHIM ), Guggenheim China Technology ETF (NYSEARCA: CQQQ ), Global X China Financials ETF (NYSEARCA: CHIX ) and Global X China Consumer ETF (NYSEARCA: CHIQ ) also bore the brunt, declining 27.46%, 25.26%, 21.25%, 16.32% and 13.71% respectively. What Lies Ahead? Given the steep decline in all the corners of Chinese space and huge numbers of trading halts, fears are largely building up in the space. Morgan Stanley ‘s head analyst of emerging markets and global macro economy views this as the biggest bubble in the last 20-30 years, while others are anticipating that China’s market turmoil might be a bigger issue than the Greece crisis. It is not only destabilizing the economy but could also have ripple effects in the global markets if it continues for long. However, the stepped-up measures taken by the government lately will soon start to pay off providing a boost to the stocks. In addition, easy cheap money flows in contrast to tightening policy in the U.S. will allow Chinese ETFs to resume their impressive ascent. Further, continued selling has made the Chinese stocks inexpensive at current levels. This is especially true given the Shanghai Composite Index and Hang Seng Index have a P/E ratio of 18.91 and 9.7, respectively, compared to 21.3 for the S&P 500 index. So investors should wait until the Chinese market bottoms out and then cash in on the opportunity of the beaten down prices with any of the above-mentioned ETFs having a favorable Zacks Rank of 2 (Buy) or 3 (Hold). Original Post