Tag Archives: alt-investing

Q2 2015 U.S. Equity Fund Performance Summary

By Tom Roseen Despite hitting multiple record highs and triple-digit lows over the three months, the markets were generally in a sideways pattern during second quarter 2015. While the Russell 2000 and the NASDAQ Composite managed to break into record territory in mid-June, advances to new highs were generally just at the margin. However, at June month-end concerns about the Greek debt drama, looming U.S. interest rate increases, Puerto Rico’s inability to service its public debt, and China’s recent market crash weighed heavily on investors. A positive finish for equities on the last trading day of June wasn’t enough to offset the Greek debt-inspired meltdown from the prior day, and many of the major indices witnessed their first quarterly loss in ten, with the Dow Jones Industrial Average and the S&P 500 losing 0.88% and 0.23%, respectively, for Q2, while the NASDAQ Composite gained 1.75%. However, the average equity fund (+0.09%) just managed to stay in the black for Q2, stretching the winning streak to three quarters in a row. For the quarter only 43 of Lipper’s 96 equity and mixed-equity fund classifications posted positive returns. For the second consecutive quarter Lipper’s World Equity Funds macro-classification (+1.22%) was at the top of the leader board, outpacing the other three broad equity groupings. USDE Funds (+0.03%) took the runner-up position for the quarter, followed by Mixed-Asset Funds (-0.66%) and Sector Equity Funds (-1.80%). In total, only 48% of all individual equity and mixed-asset funds posted plus-side returns for the quarter. Lipper’s preliminary Q2 2015 fund-flows numbers showed mutual fund investors were net redeemers of fund assets for the quarter, withdrawing an estimated $35.7 billion from the conventional funds business (excluding exchange-traded funds [ETFs]). During the quarter investors were net redeemers of money market funds (-$47.1 billion), equity funds (-$5.5 billion), and municipal bond funds (-$1.7 billion), but they were net purchasers of taxable fixed income funds (+$18.6 billion). In line with Q1 2015 and despite increasing geopolitical concerns, for Q2 U.S. fund investors favored nondomestic equity funds over domestic equity funds, injecting $34.5 billion versus withdrawing $40.0 billion, respectively. Nevertheless, conventional fund investors continued to show a clear preference for developed-market funds (+$33.9 billion) over emerging-market funds (+$3.4 billion) during the quarter. ETF investors (authorized participants) were net purchasers for Q2 2015, injecting $29.9 billion into equity ETFs while also being net purchasers of taxable fixed income ETFs (+$1.7 billion) and municipal debt ETFs (+$0.6 billion). The Sector Equity Funds macro-group (-1.80% [quarter] and -2.82% [June]) housed four of the five top-performing classifications in the equity universe for the quarter, but couldn’t keep itself out of the red, being once again relegated to the fourth-place spot of Lipper’s four macro-classifications. The macro-classification was dragged down by its also housing the four worst performing classifications in the universe. At the top of the list for the first quarter in 29 the Commodities Energy Funds classification (one of Q1’s laggards) returned 9.27% for the quarter and 0.40% for June. The classification benefitted from a rise in oil and gasoline prices during the quarter. The next best performing classification- Commodities Agriculture Funds (+5.28% for the quarter) benefitted from June’s rally in grain prices. Despite the on-again, off-again nature of the Greek debt drama, a volatile Chinese market, and a resurgence of news surrounding the possible default by Puerto Rico of its sovereign debt, the World Equity Funds macro-classification (+1.22%) remained at the top of the charts for the second consecutive quarter. Fund investors continued to pad the coffers of developed-market funds in our tally of estimated net flows for the quarter, but they also injected net new money into emerging markets-related funds. Despite its late-month meltdown in June, China Region Funds (+7.64%)-for the second quarter in three-outpaced the other classifications in the group for the quarter, followed by Japanese Funds (+3.95%),International Small-/Mid-Cap Growth Funds (+3.91%), and International Small-/Mid-Cap Core Funds (+3.82%). Japanese Funds got a boost from export-related stocks after the yen showed continued weakness against the greenback. India-related securities suffered from volatility at the beginning of June after the Reserve Bank of India revised its inflation forecast higher, pushing India Region Funds (-3.58%) to the bottom of the macro-classification for the first quarter in eight.
Time To (Re)Focus On AllianzGI’s Convertible/Income Bond Fund

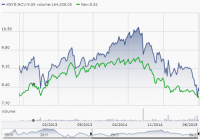
Summary For the first time in three years, NCV has traded at a discount to trading price, and this prompted the need for a review of the fund. Since my last NCV/NCZ primer (NCZ/NCV Primer), both NCV/NCZ have maintained their monthly distributions and investors have collected approximately 18% in dividend income. NCV remains a great investment vehicle for yield hungry investors with a healthy debt maturity and sector mix. The markets have been nothing close to stable for the last few weeks and this has led to the broader investment community to lose focus on their investment objectives and strategies (I mean both retail and institutional investors). For the first time in three years, the AllianzGI Convertible & Income Fund (NYSE: NCV ) has traded at a discount to trading price, and this prompted the need for a review of the fund. First off, this isn’t the first time it has happened (the price to trade below the net asset value). NCV has dipped below it’s net asset value several times historically in similar fashions – generally in response to drastic market events (in this case it’s Greece’s and Puerto Rico’s debt default scares). When the markets edge lower, like they have in the last three weeks, and many investment vehicles are impacted due to this concern, I refer to it as ” headline risk ” and without a question, the current headline risk with Greece is not good, but it isn’t going to be THAT bad for the global economy. Investors should remember/realize what exactly is at play here. In this case, it is a country defaulting/postponing/determining how to payoff debt to an entity that is unlevered and does not contain counter party risk (IMF, Germany, European Union, all other creditors). Investors, and the rest of the investment community, should realize that Greece’s headline risk is fairly isolated from investment vehicles like NCV (and the AllianzGI Convertible Fund II (NYSE: NCZ )), which trade and are meant to be benchmarked against convertible bond indices. Therefore, I felt it is time to refocus closed end fund investors back on to NCV, where global macro headline risk should not dictate the performance of convertible funds of U.S. denominated equities. Since my last NCV/NCZ primer ( NCZ/NCV Primer ), both NCV/NCZ have maintained their monthly distributions and investors have collected approximately 18% in dividend income and have been able to book 22% of returns assuming dividends were reinvested. To review the fund’s strategy, NCV invests in short to medium term convertible bonds of companies based in the United States mainly and they achieve a 12% distribution rate by levering their assets by around 33% at all times to benefit from the increased investment, and generate the high monthly distributions of approximately 13% (based on recent price levels). NCV achieves these returns in two main forms: Direct investment into convertible debt via underwritings and secondary market trading. Intra-day trading based on market opportunities to capture mispriced debt events. The downside of NCV’s strategy is that it can face liquidity constraints for some of its debt and may take on the wrong positions which will impact NAV, but difficult to compute on the market price front, making the performance of the current investments fairly difficult to transcribe. NCV Market Price vs. Net Asset Value Price Chart – NCV trades at a healthy premium to the funds net asset value price and for the right reasons… Yield demand. Source: Morningstar As shown above, NCV has consistently traded above its Net Asset Value, and this is largely due to the fact that NCV pays out a substantial dividend compared to other closed end funds. Since NCV consistently yields a monthly 12% (13% at current trading prices), investors made up of both retail and institutional distinctions have found that a 12% distribution rate is very attractive considering it can be a long term investment and executed by a reputable investment manager, Allianz. Investors do not mind paying a slight premium on the fund for the return of an above average distribution rate. NCV Annual Returns vs. Convertible Bond Benchmarks – NCV sell-off is a market overreaction (click to enlarge) Source: Morningstar Above, NCV’s trading price is compared to its convertible benchmark and based on the above chart, YTD 2015 is one of the first times where you see a divergence of NCV’s share price vs. convertible benchmark prices, outlining this investment opportunity. Generally, NCV has been able to beat this index by maintaining an active investment portfolio of convertible debt, granting positioning options the convertible bond index does not benefit from (since it is a passively tracked index). NCV Asset Allocation – The majority of the assets are in Convertible debt, which is concentrated in the United States and far from Europe Source: Morningstar To highlight why I wanted to publish this article, above is a pie chart of NCV’s asset allocation, of which is made up of 75%+ U.S. denominated debt and far from European risk. Just for clarification, the above chart is from Morningstar.com and Morningstar’s asset allocation for closed end funds is automated, confusing investors slightly since convertible debt can be identified as either “bonds” or “other” for various securities. In this case, the bonds and other categories are the convertible debt categories. NCV Bond Maturity Breakdown – With medium-term debt making up the majority of the investment portfolio, AllianzGI portfolio managers can maintain the portfolio mix for long-term investors… (click to enlarge) Source: Morningstar NCV Distributions – Investors should not see the distribution mix change, with focus to remain in distributing income to investors long term. Source: Morningstar Finally, I wanted to highlight several other factors that can help investors refocus on NCV. First, the income distributions are almost completely made up of convertible debt income funds and therefore gives investors the stability of payments since the bulk of the payouts are not driven by intra-day trading bets/performance/strategies, unlike other closed end funds. Second, the recent market price drop can be tied to the headline risk I mentioned/discussed earlier and the fact that NCV holds a portion of U.S. stock holdings in its portfolio, capturing some of the downside that the broader markets have locked onto. Third, investors who originally invested in NCV remain yield hungry and the closed end fund substitutions aren’t really here (there are only a few closed end funds that focus on convertible bonds and simultaneously yield 12% to investors). In my view, the price drop will be corrected back upward after investors have had time to digest the headline risk from Europe and broader market underperformance. NCV remains a great investment vehicle for yield hungry investors with a healthy debt maturity and sector mix, and investors should not mistaken the recent global economic issues with a closed end fund investing in convertible bonds. Disclosure: I am/we are long NCV, NCZ. (More…) I wrote this article myself, and it expresses my own opinions. I am not receiving compensation for it (other than from Seeking Alpha). I have no business relationship with any company whose stock is mentioned in this article.

CIBR Gives Investors Another Chance To Profit From Hot Growth Market

First Trust brings a new cybersecurity ETF to market to serve underserved sector. The First Trust Nasdaq CEA Cybersecurity ETF has a cheaper expense ratio and more frequent re-balancing, providing key differences to the PureFunds ISE Cyber Security ETF. The PureFunds Cybersecurity ETF is up more than 15% in 2015 and has shown the strength and growth of the sector. First Trust, a top ten fund management company, recently introduced the First Trust Nasdaq CEA Cybersecurity ETF (NASDAQ: CIBR ) to the public. The ETF gives investors a new way to invest in a basket of stocks in the hot growth cybersecurity market. After watching the strong growth of the PureFunds ISE Cybersecurity ETF (NYSEARCA: HACK ), which I profiled in December, investors will want to take a look at this new name. The new First Trust ETF will invest in stocks deemed to fit into the cybersecurity class by the Consumer Electronics Association. Other rules for inclusion are a minimum market capitalization of $250 million, average volume of $1 million over last 3 months, and a minimum free float of 20%. The First Trust fund holds 33 stocks. The companies selected range in market capitalization from $322 million to $139 billion. The average capitalization is $6.8 billion. Here is the current (7/7) top ten holdings for the First Trust ETF: Company Symbol Market Capitalization Weighting Qihoo 360 Tech QIHU $6.9 billion 6.8% FireEye FEYE $7.4 billion 6.2% Palo Alto Networks PANW $14.4 billion 6.1% Cisco Systems CSCO $137.3 billion 5.7% NXP Semiconductors NXPI $21.5 billion 5.2% Imperva IMPV $2.0 billion 3.2% Proofpoint PFPT $2.5 billion 3.2% Vasco Data VDSI $1.1 billion 3.1% Fortinet FTNT $6.9 billion 3.1% Splunk SPLK $8.5 billion 3.1% As of July 7th , there was an overlap of six companies between the two ETF’s top ten holdings. The stocks held by both in the top ten are (weighting in HACK): Proofpoint: 4.3% Imperva: 4.3% Fortinet: 4.2% Splunk: 4.2% Palo Alto Networks: 4.1% Cisco: 4.0% Along with the difference in the top ten holdings, a couple other differences are worth pointing out. The first and obvious one is expense ratio. PureFunds charges 0.75% on the ETF and First Trust will be charging 0.6%. While this isn’t a huge difference, it does mean you will pay more for PureFunds to manage your investment. The other big difference is re-balancing. PureFunds re-balances their holdings on a semi-annual basis. First Trust is planning on quarterly re-balancing. I have to side with First Trust on this one as it is the more active management and allows the company to make necessary changes more often. Since going public, shares of the PureFunds ETF have traded between $24.44 and $33.91. As of Wednesday, they were trading for $30.48 per share. The ETF is up 15.1% in 2015 to date. Shares have increased 17.9% over the last six months. Since my December article recommending the ETF, shares are up more than 11%. The ETF has also seen a large number of inflows since the start of 2015 as the sector heats up and the fact that investors had only one option. The ETF passed the $1 billion mark and as of June had more than $1.2 billion assets under management. Cybersecurity continues to be a hot growth market. Anytime there is a major security breach, the whole sector rises. Companies and major agencies continue to spend large amounts of money to protect themselves from future attacks. According to the First Trust prospectus , cybersecurity is expected to see compound annual growth of 10.3% to hit $155.7 billion by the year 2019. I pointed out the opportunity in cybersecurity back in December. At that time the hacks on Sony (NYSE: SNE ), Target (NYSE: TGT ), and Home Depot (NYSE: HD ), were still fresh in people’s minds. In June, the whole sector rose on the heels of a major government hack. The companies in this category get money when things go bad or for cleaning up messes, but ultimately get the majority of their revenue from prevention. The White House is also proposing to spend more than $14 billion in fiscal 2016 to help support cybersecurity measures. The market for cybersecurity is heating up and likely will see the projected double digit annual growth. Investors have the option to hand pick one or two stocks in the sector or buy one of these two ETFs to get invested in the sector. As far as a recommendation, I think both ETFs will outperform the market as this sector should stay hot for at least the next five year cycle. I think it would be wise to consider the new First Trust ETF with the lower expense ratio, and more frequent re-balancing. It’ll be interesting to see if First Trust gets new investor money or the assets under management on HACK takes a small hit from investors looking for greater newer investment options. Disclosure: I/we have no positions in any stocks mentioned, but may initiate a long position in CIBR over the next 72 hours. (More…) I wrote this article myself, and it expresses my own opinions. I am not receiving compensation for it (other than from Seeking Alpha). I have no business relationship with any company whose stock is mentioned in this article.