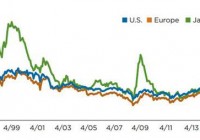
Summary Investors feel there’s little margin for error in equity markets when macro concerns such as rising interest rates and geopolitical hot spots are part of the equation. Valuations matter and investors are overly concerned with the downside and are failing to appreciate the impact of solid macro fundamentals. We may certainly see market dips, but history shows that short-term losses not caused by deteriorating fundamentals are often recovered quickly. Lately, hardly a day goes by without a headline proclaiming that developed market equity valuations are rich. Throw in macro concerns such as rising interest rates and geopolitical hot spots, and it’s no surprise that investors feel there’s little margin for error in equity markets. In this commentary, I’d like to steer away from the headlines and offer some perspective on valuations and how much they matter relative to other return drivers. In my view, investors are overly concerned with the downside and failing to appreciate the impact of solid macro fundamentals, improving earnings in Europe and Japan, and global accommodative central bank policy-forces that are sufficient to maintain or elevate equity valuations further. We may certainly see market dips, but history shows that short-term losses not caused by deteriorating fundamentals are often recovered quickly. Looking at Price/Earnings Ratios (P/E) 1 from Multiple Angles There are numerous ways to analyze valuations. I prefer 12-month forward P/Es because of their intuitive nature-they are the price of a stock divided by median analyst expectations for earnings over the next 12 months. They answer the question: How much are investors willing to pay for this stock, given what the market expects earnings to be over the next year? As Figure 1 shows, P/Es for these developed markets are reasonable, relative to long-term averages. FIGURE 1: 12-Month Forward P/E Ratios (click to enlarge) Sources: IBES; Datastream. With any valuation method, it is useful to compare current valuations to history and to other markets. Today, market consensus is that equity valuations in the U.S., Europe, and Japan are high, suggesting stocks are expensive. But valuations can rise and fall as economic regimes change, so it’s important to look at longer-term metrics as well, for a more complete picture. For example, Figure 2 shows that compared to their five-year history, valuations in all three developed equity markets are in at least the 97th percentile, meaning that forward P/Es have been cheaper 97% of the time over the last five years. However, looking back at the last 20 years, current valuations generally seem more reasonable, as evidenced by lower percentiles and higher median P/Es over that period. The U.S. and Europe do appear more expensive relative to short- and long-term history, but Japan is a different story, seeming cheap relative to its 20-year historical median, and more expensive relative to the recent five-year period. Investors should remember that during the mid- and late 1990s, the Japanese equity market experienced a bubble with very high valuations. Nonetheless, I believe it’s better to include the total history instead of subjectively excluding specific time periods, as other regional equity markets have experienced bubbles as well. FIGURE 2: Comparing Current Valuations to Historical Time Periods Sources: IBES; Datastream; Wellington Management. FIGURE 3: Comparing Current Valuations Across Regions Sources: IBES; Datastream; Wellington Management. Comparing the valuations of regional markets can also be informative. Figure 3 shows that the current P/E difference between the U.S. and Europe is 1.17, meaning U.S. equities are trading at a premium relative to their European counterparts. However, the median P/E differences over the past five and 20 years are 2.01 and 1.88, respectively, meaning that U.S. equities have historically been more expensive relative to Europe than they currently are. Put another way, European equities look expensive relative to U.S. equities today. On the other hand, Japan currently trades at a P/E discount of 2.07 versus the U.S., but over the past 20 years, Japan’s equity market traded at a 2.88 premium, and has traded close to parity with U.S. equities over the past five years. As a result, Japan looks cheap relative to the U.S. over both time periods. Considering Other Factors Valuations are only one input, and investment decisions should be based on multiple factors. For example, despite Europe’s relatively unattractive equity valuations, it remains one of my favored equity markets for more fundamental reasons. Earnings In the simplest terms, equity total returns can be thought of as the sum of dividends, earnings growth, and the P/E multiple. Valuations expand and contract, according to market cycles and investor sentiment, while dividends are fairly stable. The other important consideration is earnings. I think the earnings picture in Europe and Japan is more positive than that of the U.S. In Europe, earnings should benefit from lower fuel prices and a weak euro. In Japan, the management teams of many large companies are focusing more on adding value for shareholders by increasing returns on equity and capital. I’m less optimistic about earnings in the U.S. As Figure 4 shows, U.S. profit margins-which rose steadily following the financial crisis-appear to have peaked in 2013. At the same time, employee compensation as a percentage of gross domestic product (NYSE: GDP ) 2 -which had been falling over the same period as U.S. companies squeezed efficiencies out of everything, including labor, to prop up profits-may have turned a corner. The trend may have reached its limit; after almost eight years of record margins, wages are just beginning to rise, suggesting that earnings could suffer. FIGURE 4: Rising Wages and Falling Profits Could Squeeze U.S. Earnings U.S. Corporate Profits and Labor Compensation as % of GDP Sources: Bureau of Economic Analysis; Haver; Wellington Management. Note: This chart uses a four-quarter moving average of corporate profits after tax, with inventory and capital-consumption adjustments, as well as a four-quarter moving average of total employee compensation. Inventory and capital consumptions adjustments smooth out infrequent corporate behavior such as inventory buildups and capital consumptions. Macro Fundamentals Investors also need to consider the effects of macro fundamentals on equity markets. In the U.S., fundamentals are solid but are challenged by a stronger dollar and weaker growth in the first quarter, although some of that may be weather-related. Improved earnings in Europe and Japan are due, in part, to improving fundamentals in those regions. Business and consumer confidence in Europe is increasing, and the lower euro is helping to boost exports. Germany has been growing strongly and boasts a record-low unemployment rate of 4.7%, which should support more domestic consumption. The European Commission recently forecast that even countries that experienced negative growth last year, such as Italy, are expected to rebound into positive territory, and Spain is expected to grow 2.8% this year, double the 2014 rate. Overall, Europe still suffers from high unemployment, which will need to come down for the recovery to be sustained. But even a slight acceleration in growth from current low levels would likely be perceived by equity investors as an important development. Wellington Management’s macroeconomists expect 2015 eurozone GDP growth of around 2%. This is above consensus and reflects our general optimism on the region. I am also optimistic about the Japanese economy. Japan imports almost all of its energy, so it has enjoyed an outsized benefit from cheaper oil. The Bank of Japan’s quantitative easing program has led to improved terms of trade via a weak yen, and Japanese companies have been reporting record profits. In addition, as I mentioned above, companies in Japan are beginning to reallocate capital for shareholders’ benefit. One of the catalysts for this shift is macro in nature. The Japanese government has pushed for the creation of an index (JPX Nikkei 400) comprised only of those companies that meet high standards of corporate performance and return on equity. The Bank of Japan and the world’s largest government pension fund, Japan’s Government Pension Investment Fund, now use this index to measure performance of their equity portfolios. All these changes should contribute to solid growth for Japanese equities. Importance of Differentiating Between Noise and Signal As always, risks can weaken an investment thesis. Four major risks on investors’ minds are: a Greek exit from the euro, an escalation of the Russia/Ukraine conflict, a hard landing for China’s economy, and a significant rise in interest rates. If any of these risks come to fruition, I would expect a sustained sell-off in global equities. I believe the risks of these events occurring are low, but I would expect noise related to them could result in isolated, albeit sharp, sell-offs. This would cause short-term pain, but analysis I’ve done on this issue shows that the effect on equities tends to be short-lived and these dips are often buying opportunities. Sell-offs of at least 2% occur an average of nine times per year in the S&P 500 Index, but the market generally recovers in short order. Figure 5 (which uses U.S. data, but is illustrative of developed markets as well) shows that median 10-, 30-, and 60-day total returns following sell-offs of 2% or more are, on average, greater than returns following any random day. The results are even more compelling when controlling for the economic environment. When the U.S. Purchasing Managers Index (PMI) 3 (a metric used to help gauge economic strength) is above 50, signaling economic expansion, total returns following a 2% or greater sell-off are around twice as high as those following any random day. I expect the U.S., European, and Japanese economies to continue expanding in the near term. The recovery effect indicates that “tail risks” from exogenous factors can impact daily returns, but markets ultimately focus on fundamentals and recover from panic-driven one-day dips. Note: Due to the heterogeneity of emerging markets, I have limited the scope of this commentary to developed markets. FIGURE 5: U.S. Stocks Have Historically Rebounded After Most Sell-Offs S&P 500 Forward Total Returns Sources: Bloomberg; Institute for Supply Management; Haver; Wellington Management. Note: The analysis uses S&P 500 Index total returns over 10-, 30-, and 60-day forward periods since 1989. The PMI used is the Institute for Supply Management’s Composite Index. The blue diamonds represent the median return over 10, 30, and 60 days following any random day, regardless of the prior day’s performance. The orange squares represent the median return over 10, 30, and 60 days following a 2% or greater loss. The green triangles represent the median return over 10, 30, and 60. Investment Implications Developed equity valuations are reasonable. While valuations look rich over the recent past, a longer history suggests they are closer to fair value. Consider factors beyond valuations. Investors should also consider potential earnings growth and economic fundamentals. Favor Europe over the U.S. Despite rising valuations, a virtuous cycle of a weak euro, quantitative easing, and cheap oil is forming, and earnings should benefit. Favor Japan over the U.S. In addition to attractive valuations, Japanese companies are recording record profits and focusing on maximizing shareholder value. Notes 1 Price-Earnings Ratio is valuation ratio of a company’s current share price compared to analyst median 12 month forward per-share earnings. 2 Gross Domestic Product is the monetary value of all the finished goods and services produced within a country’s borders in a specific time period. 3 Purchasing Managers Index (PMI) is an indicator of the health of the economy. Disclaimer: Investors should carefully consider the investment objectives, risks, charges, and expenses of Hartford Funds before investing. This and other information can be found in the prospectus and summary prospectus, which can be obtained by calling 888-843-7824 (retail) or 800-279-1541 (institutional). Investors should read them carefully before they invest. All investments are subject to risks, including possible loss of principal. Investments in foreign securities may be riskier than investments in U.S. securities. Potential risks include the risks of illiquidity, increased price volatility, less government regulation, less extensive and less frequent accounting and other reporting requirements, unfavorable changes in currency exchange rates, and economic and political disruptions. These risks are generally greater for investments in emerging markets. The views expressed here are those of Nanette Abuhoff Jacobson. They should not be construed as investment advice or as the views of Hartford Funds. They are based on available information and are subject to change without notice. Portfolio positioning is at the discretion of the individual portfolio management teams; individual portfolio management teams may hold different views and may make different investment decisions for different clients or portfolios. This material and/or its contents are current at the time of writing and may not be reproduced or distributed in whole or in part, for any purpose, without the express written consent of Wellington Management. All information and representations herein are as of May 2015, unless otherwise noted. Disclosure: I/we have no positions in any stocks mentioned, and no plans to initiate any positions within the next 72 hours. (More…) I wrote this article myself, and it expresses my own opinions. I am not receiving compensation for it. I have no business relationship with any company whose stock is mentioned in this article.