Tag Archives: alt-investing

Ford Vs. Tesla

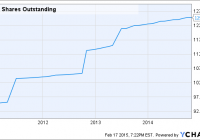
Summary I am not particularly bullish – slightly bearish, in fact – on the auto industry, but I see a relative value play between Ford and Tesla. Ford had a very solid 2014 and should build on that in 2015, barring a macro economic downturn. Tesla ended 2014 on a low note and will continue to bleed money into 2015 and beyond. A pair trade could be a low-risk way to play F and TSLA and largely mitigate the risk of economic distress. Earlier this month, I began a new mock portfolio here on Seeking Alpha: the Pairs Trade Portfolio; today I continue it with trades on Ford (NYSE: F ) and Tesla (NASDAQ: TSLA ). A pair trade is a market-neutral hedge in which an investor essentially pits one company against another. Getting a return on a pair trade is not dependent upon a particular stock rising or falling necessarily, but dependent upon the relative price moves between two stocks (or other financial instruments). I won’t go into details about the hows and whys of pair trading here, as I have already described the theory in detail in a previous article. Please take a look at the link for more information on why pair trades might be a good investment. Previous articles with pair trades for the portfolio: The Auto Industry The industry is extremely sensitive to the global economy as a whole. By and large, people don’t have a pressing need to buy a car and the purchase can normally be put off for months and even years and therefore in tough economic times car sales plummet. I think that notion of “purchase delay” has never been more true than now due to the fact that automobiles are more reliable now than ever. Because of the auto industry’s reliance on a good economy, I’m actually somewhat bearish to neutral on auto companies right now. I predict the global economy will underperform expectations over the next couple of years (at least) with an excellent chance of stock market crashes and recessions. I wrote a piece about the top 7 economies – that account for 74% of world GDP – in an article titled ” The Ingredients For An Imminent Bear Market Are In Place ” in which I noted why I felt that US equities, in particular, were due for a fall. So, why am I buying Ford and shorting Tesla for my Pairs Trade Portfolio? Well, because the whole point of a pair trade is to make an investment that takes out the uncertainty of outside events. By buying Ford and selling Tesla, I am making a bet on Ford vs. Tesla and that is all. If Ford stock drops to $8 per share and Tesla drops to $50, I’ve made money. If I am completely daft about the state of the economy and Ford moves to $30 while Tesla moves to $300, then I’ve still made money, though obviously not as much as I would have being solely long. The phrase “market-neutral hedge” is critical when talking about a pair trade. Again, if the reader has lingering questions about it, please click on the link near the top of this article for more information. And now onward to discussion of the two companies. Ford’s Prospects I consider Ford to be the best risk/reward choice of the automakers for a number of reasons, but three big ones come to mind immediately: Lower gas prices means more large vehicle sales and the higher profits that go with them. Ford rules in the pickup arena and 2015 could be a banner year for F-150 sales given low gas prices along with a redesign of the truck. Asia/Pacific sales. Cheap valuation. As for pickup sales, Ford is still the king and will likely stay that way throughout 2015. In January 2015 , Ford sold over 54,000 F-Series trucks compared to 36,000 Chevy Silverado sales. It appears that the public is responding well to the revamped F-150 and I expect it to be the best selling vehicle in the US for the 34th year in a row in 2015. I want to go into the Asia/Pac region in a bit more detail as I consider that region to be extremely important in the long run. I wrote about it in a previous article on Ford, saying that: Ford is executing well in Asia Pacific, which is the region with the most growth potential for the next decade (at least). However, keep in mind that Asia Pacific is not currently a large component of Ford’s business. Units sold in the Asia Pacific region represented about 21% of the total units sold for the company in Q1 2014. However, the revenues by region are as follows: Asia Pacific: 7.8% of the company total; North America: 60.4% of the company total; Europe: 22.9% of the company total. Those numbers were from Q1 2014. Today I am looking at Ford’s most recent investor presentation and I see many highlights pertaining to the region including: Asia/Pac employment increased 25% from 2013 to 2014; China market share increased from 4.1% to 4.5% (Y/Y); Record profit in Asia/Pac in 2014; Revealed new global Explorer and the all-new Everest for Asia/Pac; Over 1 million units sold in Asia/Pac in 2014. Clearly, Ford’s strategy in Asia is working well and the company is picking up profits in the region at a record pace. The growth prospects are enormous in that region and it is one that I will continue to keep my eye on. Finally, the valuation of Ford is cheap based on analyst expectations . The stock’s forward P/E for 2015 and 2016 is at 10.0 and 8.7, respectively. I’ve already noted that I am still not fully bullish on Ford because I think those estimates don’t take into account the risk of a serious miss. But it is worth noting the price of the shares based on those analyst expectations. There is solid upside to the stock based on earnings alone if macro events don’t derail it. Tesla Prospects I’ll stick with the Asia theme to start off and note that in January 2015, Tesla sold about 120 cars in China. That linked article also notes that “Musk has previously said he expected China sales could rival those in the United States as early as 2015.” The shortfall is important not just because Tesla’s market in China is non-existent, but also it shows just how incredibly off the mark Musk was in his prediction. If there is one common theme amongst the Tesla stockholders, it is the unshakable belief in the “Temple of Elon.” He is not infallible. As for China, Tesla has, to date, wasted its time and money on the country since 2013 (when orders began there) as it has basically nothing to show for its efforts. Moving on to some financial considerations, the company is spending money at an alarming rate. For example: The company spent $970 million in capital expenditures in 2014 while the 2013 capex was $264 million. A poor Q4 performance saw it post a loss of over $100 million – the loss was nearly $300 million for the full year. The company burned through a considerable amount of cash in Q4: $465 million. Long-term debt and “other long-term liabilities” increased from $881 million in 2013 to $3.069 billion in 2014. In addition to the added debt, Tesla is diluting its stock steadily in order to fund operations (the large steps upward) and pay management (the slower, grinding upward slopes): TSLA Shares Outstanding data by YCharts We can clearly expect to see more dilution and more debt in for the next several years in order to fund operations, capex, and compensation. Elon Musk predicted GAAP profitability in 2020 and I estimate that (if and only if all goes well) Tesla will show solid positive cash flow a year or two before that. Until then Tesla will need a lot of additional financing. There’s nothing wrong, per se, for a company to spend lots of money, incur debt, and even dilute its stock. However, when a company does those things and has a stock price that is (still) quite high and full of expectations, the bar is set extremely high for that company to execute. In other words, Tesla better be spending all that money wisely. Some Valuation Comparisons Ford’s market cap is about $62 billion and Tesla’s cap is about $25.5 billion and thus Ford is valued at just under 2.5 times that of Tesla. Some of the charts comparing the two companies are actually comical, but I think they illustrate my point well. First, the difference in revenue: F Revenue (TTM) data by YCharts Ford has about 45x the revenue of Tesla. Tesla is growing revenue much faster than Ford, but is so far behind its more established rival. The cash from operations: F Cash from Operations (TTM) data by YCharts Tesla has bounced up and down from negative to positive and back to negative again as the company struggles to limit the bleeding. I showed Tesla’s dilution above, now let’s see Ford’s shares outstanding: F Shares Outstanding data by YCharts There is a bit of upward creep there over the last few years, but it is minor – especially compared to Tesla. None of the above charts should be of any surprise to an investor in either company, but I think they do serve to show us the amount of faith that Tesla investors have. For the company to be valued at 40% of Ford means that an incredible amount of success is priced into the stock. In my opinion, TSLA should be no more than 10% of Ford. Conclusion At this point, a lot of things have to go right for TSLA stock to be worth the price it currently commands. The company will add more debt and it will dilute the stock further. Not only must Tesla continue to grow revenues and deliver cars at a rapid pace, but it must soon start to give us a glimpse of a profitable future. Moreover, Tesla is about to encounter ramped up competition in its EV space. General Motors (NYSE: GM ) has announced the development of a 200-mile range electric car that should directly compete with Tesla’s Model 3, set to debut in 2017. I have no doubt that many, if not all, major manufacturers will be making similar announcements of long-range EVs throughout 2015, including Ford (heck, maybe even Apple). At some point in the not-too-distant future, carmakers will have multiple EVs in the stable including luxury and sport models. How can TSLA stock stay, or indeed rise from, the level it is at when the company will no longer be unique? Ford, for its part is reasonably predictable, at least relative to Tesla. The stock does not move quite “…as peacefully and leisurely as a python digesting a Valium addict.” (Tom Robbins from Skinny Legs and All ), but it does trade, in the main, based on fundamentals instead of sentiment and hope. The company has a long history of success and should continue to grow and expand its success into new locations and with new models, including EV models. Ford (and all established car makers) has the advantage of being able to invade Tesla’s market whenever and however it chooses. Ford can and will make EVs that compete more directly with Tesla than they do now and when a big company like Ford moves into a small company’s space, there is a tendency for bad things to happen to the smaller company. The Portfolio At 8 p.m. Eastern Time on February 17 I’m buying F and shorting TSLS in my Seeking Alpha portfolio. Here is what the mock portfolio looks like so far after three pair trades (note that I plan on adjusting, adding, and updating this for years): A wee profit! Nice to see, although fairly meaningless this early in the game. Be sure to click “follow” if you would like to get real-time alerts on my future articles. Disclosure: The author has no positions in any stocks mentioned, and no plans to initiate any positions within the next 72 hours. (More…) The author wrote this article themselves, and it expresses their own opinions. The author is not receiving compensation for it (other than from Seeking Alpha). The author has no business relationship with any company whose stock is mentioned in this article.
U.S. Stocks And U.S. Bonds: What The Heck?

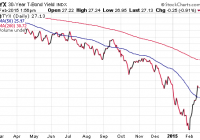
It is hard to believe just how many folks expect the U.S. stock market to rise substantially in the current environment. U.S. stocks and U.S. bonds are extremely overvalued. As long as one has a plan for exiting – rather than foolishly hoping-n-holding – one is able to minimize the risk of remaining invested in overvalued equities. Most people believe that Tom Cruise became an international superstar with the release of the action drama, “Top Gun” back in 1986. However, I remember the actor from an earlier film, “Risky Business.” The popular motion picture capitalized on teenage angst and harebrained ways to make money. In the film itself, the main character, Joel Goodson, turns his family home into a house of ill-repute to finance the repairs of his father’s Porsche – a car that he had been warned not to use, yet inadvertently destroyed. By the end of the movie, increasingly perilous behavior helped Joel get into Princeton, as opposed to him following a straighter-and-narrower path. Fans may recall the risk-taking tagline, “Sometimes you just gotta say, ‘What the Heck.'” In Hollywood, at least for the sake of on-screen comedy, irrational audacity may prove rewarding. In real life, however, investors tend to be compensated for taking reasonable risks. Granted, speculators can sometimes profit from bizarre decisions. Yet an investor who allows over-the-top exuberance to cloud sound judgment typically gets battered by panicky reversals of fortune. Indeed, it is hard to believe just how many folks expect the U.S. stock market to rise substantially in the current environment. Companies are not selling as much as they had anticipated as shown by rising manufacturer, wholesaler and retailer inventories. Companies in the S&P 500 are not profiting as much as executives had hoped either; analysts have been dramatically ratcheting down earnings expectations. Meanwhile, the parade of weak economic reports continue to flow in, from producer prices (excluding food and energy) registering an unexpected decline to smaller-than-expected gains in industrial production. Downward revisions to gross domestic product are a near certainty. What are the implications for the investing public? Sadly, it is a world where the two primary asset classes stateside – U.S. stocks and U.S. bonds – are extremely overvalued. And yet, the choices of how to manage the overvaluation in one’s portfolio are not particularly attractive either. Since there are no meaningful risk-free rates of return in a zero percent interest rate environment, investors have been choosing between risky and riskier alternatives. In one corner, expensive U.S. stocks may continue to appreciate on additional corporate buybacks as well as the possibility of economic acceleration. In the other corner, appallingly low-yielding U.S. bonds may produce total returns that exceed stocks due to the former’s relative value against developed world bonds; most of the developed world’s fixed-income yields are noticeably lower than comparable U.S. maturities. Of the two alternatives, I am still favoring long-term U.S. treasuries in client portfolios. The German 30-year bund yield is under 1%, while the Japanese 30-year is near 1.5%. As silly as those yields are, they are not likely to rise appreciably when the Bank of Japan (BOJ) and the European Central Bank (ECB) are in early stages of bond buying via quantitative easing exercises. Even more alarming? The 30-year yields for France, Canada and Italy are 1.45%, 2.12% and 2.61% respectively. We’re talking about fiscally irresponsible Italy having a lower yield than the U.S. at 2.71%. Does it not make sense to consider long-term U.S. bond exposure via the Vanguard Extended Duration Treasury ETF (NYSEARCA: EDV ) or the PIMCO 25+ Year Zero Coupon U.S. Treasury Index ETF (NYSEARCA: ZROZ ), especially when the 30-year yield has reverted back to a 50-day moving averages? Buying bond dips can be as rewarding as buying stock dips. The increasingly unattractive prospect of robust exposure to U.S. stocks has not kept me from sticking with the trends. My clients will continue to own funds like the iShares S&P 100 ETF (NYSEARCA: OEF ), the Health Care Select Sect SPDR ETF (NYSEARCA: XLV ), the Vanguard Mega Cap Growth ETF (NYSEARCA: MGK ) as well as the iShares MSCI USA Minimum Volatility ETF (NYSEARCA: USMV ) until there is a significant breach of the 200-day moving average on the downside. What-the-heck pricey? You bet. On the other hand, the market can remain insanely effervescent for a whole lot longer than an investor can accept 0% in a money market. As long as one has a plan for exiting – rather than foolishly hoping-n-holding – one is able to minimize the risk of remaining invested in overvalued equities. It is important to recognize, though, that stock uptrends in foreign markets come with lower P/E price-tags. Conservatively speaking, developed world stock assets trade at a 10%-15% P/E discount to the U.S., while broad-based emerging market stock assets may be trading at a 20% to 25% discount. It has been more difficult for me to embrace either the Vanguard FTSE Europe ETF (NYSEARCA: VGK ) or the Vanguard FTSE Emerging Markets ETF (NYSEARCA: VWO ) yet, as both have resistance at their respective 200-day trendlines and both do not have the currency-hedged exposure that I prefer at this moment. In contrast, I have advocated for several months on behalf of the iShares Currency Hedged MSCI Germany ETF (NYSEARCA: HEWG ) on the expectation that as the most successful exporter in the region, Germany will benefit the most from the battered euro. What’s more, HEWG’s uptrend is intact. Disclosure: Gary Gordon, MS, CFP is the president of Pacific Park Financial, Inc., a Registered Investment Adviser with the SEC. Gary Gordon, Pacific Park Financial, Inc, and/or its clients may hold positions in the ETFs, mutual funds, and/or any investment asset mentioned above. The commentary does not constitute individualized investment advice. The opinions offered herein are not personalized recommendations to buy, sell or hold securities. At times, issuers of exchange-traded products compensate Pacific Park Financial, Inc. or its subsidiaries for advertising at the ETF Expert web site. ETF Expert content is created independently of any advertising relationships.

West Port Congestion To Hurt These ETFs

The slowdown at 29 West Coast cargo ports is getting worse with operations having been suspended yet again last weekend. This represents the second partial shutdown at these ports in a week and is the result of an escalating labor dispute with the dockworkers’ union. The International Longshore and Warehouse Union, representing 20,000 dockworkers, has been in negotiations for nine months with the Pacific Maritime Association, with no effective labor deal till now. It is estimated that the partial shutdown will result in a loss of billions of dollars in trade, especially with Asia, hampering trade of electronics, clothes, toys and car parts. Notably, the 29 ports handle nearly half of all U.S. maritime trade and more than 70% of imports from Asia, representing around $1 trillion of cargo a year (read: Is Cheap Oil Driving Transport Earnings and ETFs? ). The conflict is disrupting the supply chain of American exporters, automakers, manufacturers, farmers and retailers, and is taking a toll on consumer goods, food, clothing and other products. It is also leading to higher expenses in the form of additional airfreight cost and other transportation fees that will likely dilute the profit margins of companies. Additionally, the impact has also been felt in the transportation sector due to slower freight traffic by trucks and rails. The National Retail Federation warned that a full strike or lockout at the West Coast ports could cost the economy $2.1 billion a day. Last time, the shutdown of West Coast ports for a 10-day period in 2002 had cost the U.S. economy about $1 billion a day. The situation has placed the retailers, who have to ship their inventories abroad before the busy spring shopping season, in a quandary. The labor strife has put a pause on shipping and may cost retailers as much as $7 billion this year. Notably, the U.S. footwear retail industry, which solely depends on imports, seems in deep trouble (read: Should You Keep Holding the Retail ETFs? ). The agricultural industry is no way behind as exports have fallen as much as 50%. California’s citrus industry has already seen a 25% decline in its export business, losing about $500 million in sales according to the trade group California Citrus Mutual. The deadlock is further threatening the $2.4 billion citrus industry at a time when the demand for California citrus usually peaks. Further, the meat and poultry industry is losing more than $40 million per week, as per the North American Meat Institute. Even if the nine-month labor dispute is resolved, it could take a couple of months for the economy to return to normal. Given this, a number of industries could see further slowdown from this 29-port dispute, pushing down the stocks and ETFs in the coming months. Below, we have highlighted three funds that are in focus. Though these products have a Zacks ETF Rank of 3 or ‘Hold’ rating, these could see rough trading in the days ahead given the port gridlock. iShares U.S. Consumer Goods ETF (NYSEARCA: IYK ) This fund provides exposure to 115 stocks that are engaged in a wide range of consumer goods, including food, automobiles and household goods. It tracks the Dow Jones U.S. Consumer Goods Index and charges 43 bps in annual fees. The fund is highly concentrated on the top five firms with the largest allocation going to Procter & Gamble (NYSE: PG ) at 10.8%, followed by Coca-Cola (NYSE: KO ) and PepsiCo (NYSE: PEP ) with at least 7% share each. All the three firms have an unfavorable Zacks Rank #4 (Sell), suggesting their underperformance in the months to come (read: Coca Cola, PepsiCo Earnings Stir Up Consumer Staples ETFs ). From a sector look, food & beverage accounts for 48.1% while household & personal products, consumer durables and autos & components round off the next three spots with a double-digit allocation. The product has amassed $656.8 million in its asset base and trades in moderate volume of about 72,000 shares a day on average. The ETF is up 1.8% so far in the year. iShares Transportation Average ETF IYT) The ETF tracks the Dow Jones Transportation Average Index, giving investors exposure to a small basket of 20 securities. The product puts heavy focus on the top five firms at roughly 43.2% with the largest allocation going to FedEx (NYSE: FDX ) , Union Pacific (NYSE: UNP ) , and Kansas City Southern (NYSE: KSU ) . The three firms currently carry a Zacks Rank #3 (Hold). From a sector perspective, about half of the portfolio is dominated by railroads while the delivery service sector makes up for nearly 28% share. The fund has accumulated $1.7 billion in AUM while it sees a good trading volume of more than 515,000 shares a day on average. It charges 43 bps in annual fees and has lost over 1% so far this year. iPath DJ-UBS Livestock Total Return Sub-Index ETN (NYSEARCA: COW ) This note tracks the Dow Jones-UBS Livestock Subindex Total Return, which delivers returns through futures contracts on livestock commodities. The benchmark provides 69% exposure to live cattle and the remainder to lean hogs. The product charges 75 bps in fees per year and has amassed $23.9 million in its asset base. It trades in average volume of about 18,000 shares a day, suggesting additional cost in the form of a wide bid/ask spread. The ETN is down 12.1% in the year to date time frame. Bottom Line These products could underperform in the coming months given that the malaise from the West port bottleneck will likely persist even if the dispute is resolved. As a result, investors should stay away from these ETFs for now.