Tag Archives: alerts

Problems With ‘The Long Term’

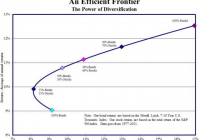
John Maynard Keynes once famously said “In the long run we are all dead.” But the full quote doesn’t often get hashed out. Keynes said: But this long run is a misleading guide to current affairs. In the long run we are all dead. Economists set themselves too easy, too useless a task, if in tempestuous seasons they can only tell us, that when the storm is long past, the ocean is flat again.” Keynes was pointing out that many economists use a multi-temporal approach to economics to prove very generalized points. Milton Friedman was notorious for this. He was a master of holding multiple positions at the same time thereby allowing him to change the time frame however he pleased so that his argument always worked. For instance, he might say “Oh, velocity of money isn’t having an impact in the short term, but my extensive historical data shows that in the long term, an increase in the money supply will cause velocity of money and inflation to increase” (not a real quote, just to be clear). Many people have heard some version of this in the past 5 years as we waited for the big inflation from QE to come. The use of “the long term” in economics is often another version of “My model has been wrong so far, but if we wait long enough it will be proven right!” This sort of flip flopping could allow someone to hold two opposing positions at the same time and get away with it. It’s a classic trick in economics and when someone flips between time frames it should immediately raise a red flag for you. But economics isn’t where this concept is most abused. Modern finance has been driven largely by similarly unrealistic models of the world (largely derived from the same general models that Friedman and the Chicago School of Econ devised back in the 50s, 60s and 70s). For instance, take the concept of the Efficient Frontier which generally looks something like this: Basically, stocks will outperform cash and bonds over the long term. But there’s that term again – the “long term.” As Cliff Asness recently showed the “short term” doesn’t add much clarity here because asset prices perform with a high degree of randomness over a 5 year period. But how well does the concept of the “long term” really apply to someone’s life? I want to revisit the Intertemporal Conundrum because I think it’s a crucial concept in portfolio construction that often goes overlooked when applying overly simplistic models like the ones espoused by proponents of Modern Portfolio Theory. Most people begin investing in their 20s, but don’t accumulate a significant chunk of assets until their 30s or 40s. So this gives most of us a time frame of about 25-35 years before retirement. Of course, our financial lives aren’t one clean linear ride from our 20s to retirement. There’s the wedding, the kids, the college tuitions, the new house, the cars, etc. Our financial lives don’t actually reflect a “long term” at all. They’re more like a series of short terms inside of a long term. But it gets more problematic as you apply this. Modern Portfolio Theory will tell you that as you near retirement, you should ratchet back your equity holdings to reduce the volatility in your portfolio because you no longer have a “long term” time horizon. But this is problematic because it means that the 30 year old investor with a 70/30 stock/bond allocation doesn’t really have 70% of their portfolio invested for “the long term.” When they ratchet it back to a 60/40 at age 40 10% of their 70% equity holding will have only been invested for a 10 year time horizon. And when they ratchet back to a 50/50 at age 50 almost a third of their equity portfolio will have been invested for a 20 year period. This all becomes even more problematic because our earnings tend to increase as we get older which means we are contributing more dollars per portfolio size as we age. And when you combine this with the necessary near-term spending needs that often arise as a result of life’s short-term events then our “long term” portfolios suddenly don’t mesh with the MPT story all that well. That is, our “long term” actually proves to be a series of “short terms.” Applying a “long term” to the Efficient Frontier makes it work in theory, but in reality it proves to be far less useful. I advocate treating people’s portfolios like a Savings Portfolios for a very specific reason ( see here for more detail ). I think it’s crucial to treat these portfolios as a place where we create stability and certainty in our necessarily short-term financial lives. The ideas espoused by MPT are not only unrealistic textbook models, but they often lead people to believe that they can afford to take more risk than they should simply because they believe stocks always outperform bonds in the long term. And when you combine all of this with our inherent behavioral biases, you get a situation that is ripe for mistakes. That is, our textbook models trick us into thinking we can handle a lot of risk, but when reality strikes we often realize that the textbook model led us astray. And by then it’s too late. And sadly, the vast majority of Wall Street firms rely on models that are some derivative of this sort of thinking. This doesn’t mean that the concept of the “long term” is useless and it certainly doesn’t mean that short-term market timing is necessarily good. But we have to be very careful about how we go about applying this to our actual financial lives. While the “long term” often sounds great in theory, it often turns out to be a disaster in reality.

Why Value Works: Low Trading Volume

One aspect or explanation why value works is the low trading volume, which is often typical for companies in which we invest. A new paper by Roger Ibbotson and Thomas Idzorek , who work for GMO, a fund management group where James Montier works as well, in the Journal of Portfolio Management, which analysed 40 years of stock returns by putting them into a perspective to the average trading volume of the last year. The paper finds stocks in the least popular quartile outperformed those in the most popular segment by seven percent. In their paper “Dimensions of Popularity,” Ibbotson and Idzorek identify the most common market premiums and anomalies, such as: Small cap – Smaller capitalization stocks outperform larger capitalization stocks Valuation – Value companies beat growth companies Liquidity – Less liquid stocks beat those with more liquidity Momentum – Stocks trending up will continue to trend up Because the risk-return framework does not explain all these premiums and anomalies seen in the market, the researchers propose the unifying “theory of popularity.” The authors explain that the most common market premiums and anomalies are associated with a stock’s popularity or unpopularity. For example, if investors “vote with their dollars,” small cap companies have gotten fewer votes. Value companies commonly have something wrong with them, which makes them unpopular. If an asset has characteristics that investors really dislike, such as low liquidity, little name recognition, or high volatility, its price will be lower and therefore its expected future returns will be higher, all other things being equal. According to the theory of popularity, if an investor were to rank stocks by popularity, he or she could buy a basket of unpopular stocks and systematically rebalance as the stocks become more popular by buying a new portfolio of relatively less popular stocks. As some of the stocks in the portfolio become more popular over time, they become more valuable and the investor will see appreciation. This cycle happens normally in Deep Value situations where trends tend to revert to the mean. “Risk has become a catch-all for all of the attributes that investors do not like, but riskiness does not explain all the anomalies we see in the market. Value premiums are a perfect example. Stocks with low market-to-book ratios or low price-earnings ratios are not necessarily more volatile or less liquid, but we know that over time value stocks beat growth stocks. We need a new model for explaining investment performance that goes beyond risk and return. Popularity may be a better lens through which to view investment behavior,” Ibbotson said. “Many of the well-known market premiums are associated with unpopular stocks. Unpopular stocks tend to be smaller, less liquid, and perceived as lacking growth potential. These stocks, with their low relative prices, may offer investors better future performance as they move along the spectrum toward popularity.” Have a good week. Share this article with a colleague

Bill Gross Has Started To Sell His Pimco Closed-End Funds

Summary This week there have been a few SEC Filings with Pimco Fund Sales. Thus far only three funds have been partially sold. The selling may provide a good buying opportunity at some point. I have previously written some articles describing Bill Gross purchases or sales of Pimco closed-end funds. While he worked at Pimco, Mr. Gross often supported Pimco’s CEFs with his personal money. There was also “copycat” buyers who often followed Mr. Gross into some of these issues. Bill Gross resigned from Pimco on September 26. Since then, closed-end fund investors have been wondering whether or not Mr. Gross would sell some or all of his Pimco CEF holdings. This week we finally started to see some SEC filings with sales of Pimco CEFs from Mr. Gross. These are the first trades since Mr. Gross resigned from Pimco in September. There is normally a two day filing delay, so the filings for February 5 show the trades done on February 3. It remains to be seen whether the selling is completed, but in the past, buying or selling often continued for a week or longer. Shares Tkr Sell Date Average Price $ Realized Discount/Premium (Feb. 5) 50,000 PDI 3-Feb 30.2641 $1,513,205 -0.8% 32,733 PDI 2-Feb 30.304 $991,941 6,630 PTY 2-Feb 16.7823 $111,267 +19.2% 22,649 PCN 3-Feb 15.3397 $347,429 +4.2% 29,200 PCN 2-Feb 15.3856 $449,260 Bill Gross owns several Pimco closed-end funds that hold tax free municipal bonds. PCQ and PZC hold tax free bonds from the state of California. Even though his new employer, Janus Capital Group, has headquarters based in Colorado, Mr. Gross has arranged to work out of an office in California. For this reason, I expect he will likely hold onto his California muni bond funds. Some of his other national muni bond fund positions may be sold depending on their cost basis to be replaced with similar funds from Janus. One fund that Mr. Gross has not sold yet that still looks fairly attractive is PCI. I’ve included some summary data for PCI below. But keep in mind that Mr. Gross currently owns about 2.4 million shares of PCI, so if he ever did decide to sell PCI, there could be quite an overhang. Pimco Dynamic Credit Income (NYSE: PCI ) -pays monthly Total Assets= 5,717 MM Total Common Assets= 3,096 MM Annual Distribution (Market) Rate= 9.12% Latest Monthly Distribution= 0.1563 (annual= $1.8756) Average Monthly Earnings per Share= $0.1804 (as of 06/30/2014) Fund Baseline Expense ratio= 1.30% Discount to NAV= -8.9% Average Six Month Discount= -8.8%% Effective Leverage: 46% Average Daily Volume: 712,000 Average $ Volume: 14.6MM Manager: Dan Ivascyn + team Disclosure: The author is long PCI. (More…) The author wrote this article themselves, and it expresses their own opinions. The author is not receiving compensation for it (other than from Seeking Alpha). The author has no business relationship with any company whose stock is mentioned in this article. Are you Bullish or Bearish on ? Bullish Bearish Neutral Results for ( ) Thanks for sharing your thoughts. Submit & View Results Skip to results » Share this article with a colleague