Scalper1 News
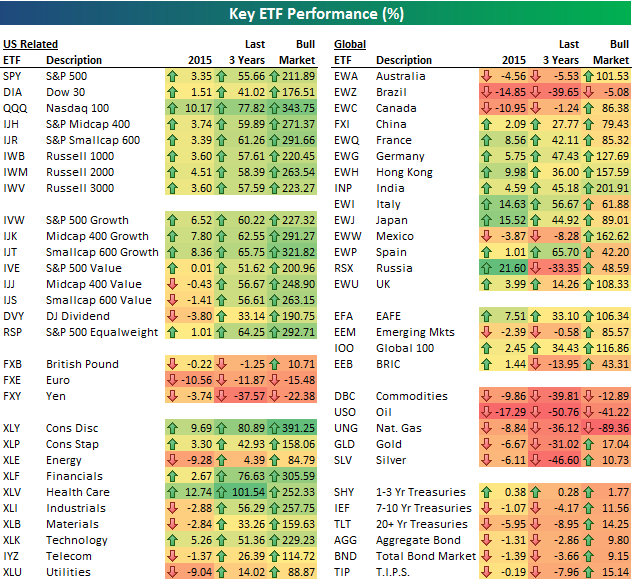 We post the ETF matrix below on a regular basis to highlight short-term movements in various asset classes. But today we’ll take a look at long-term performance: YTD, over the last 3 years, and since the bull market began on March 9th, 2009. Keep in mind that these are simple price returns and don’t include dividend payments. Over the last 3 years, the US Health Care ETF (NYSEARCA: XLV ) is up the most of any ETF in our matrix with a gain of 101.5%. Consumer Discretionary (NYSEARCA: XLY ) is up the second most with a gain of 80%, and the Nasdaq 100 (NASDAQ: QQQ ) ranks third at +77.8%. Not all sectors are up significantly over the last 3 years – the Energy ETF (NYSEARCA: XLE ) is up just 4.39%. And not all ETFs in our matrix are in the green over the last 3 years either. The yen ETF (NYSEARCA: FXY ) is down 37.5%, while Brazil (NYSEARCA: EWZ ) and Russia (NYSEARCA: RSX ) are both down 30%+ as well. Commodities ETFs are also deep in the red across the board, with oil (NYSEARCA: USO ) leading the way lower at -50%. During the current bull market going back to March 2009, the Consumer Discretionary ETF ( XLY ) is up the most at +391.25%. The Nasdaq 100 ( QQQ ) is up 343%), while the S&P 500 (NYSEARCA: SPY ) is up 211.9%. Outside of the US, India (NYSEARCA: INP ) has done the best at +201.9%, followed by Hong Kong (NYSEARCA: EWH ) at 157%. Brazil ( EWZ ) is actually down 5% since 3/9/09. Out of the entire ETF matrix, the UNG natural gas ETF is down the most since 3/9/09 with a decline of 89%. Hopefully you’ve avoided that one! Share this article with a colleague Scalper1 News
Scalper1 News