Scalper1 News
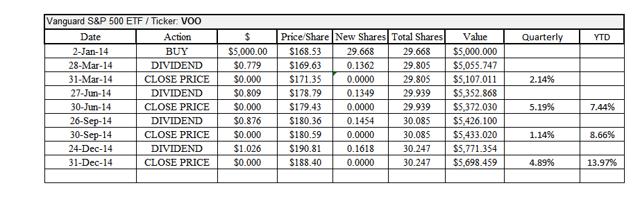
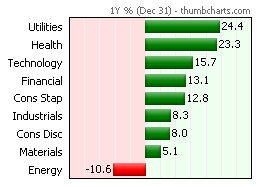
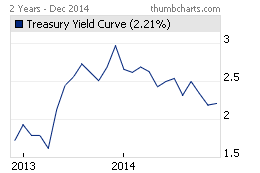
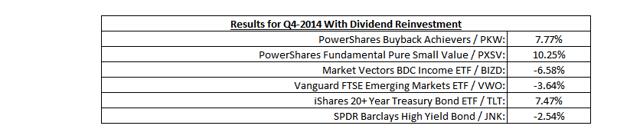
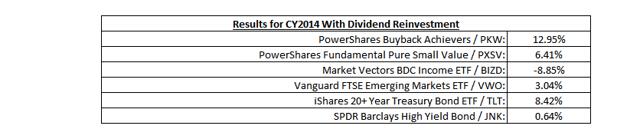
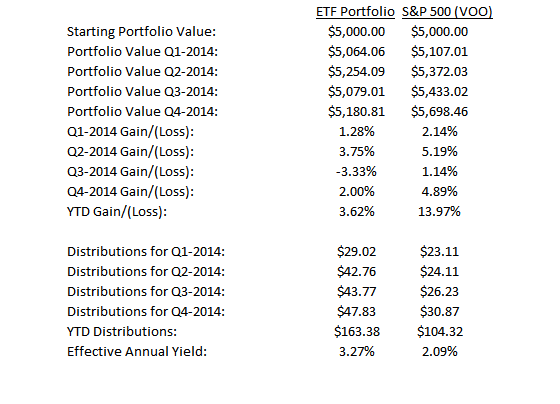
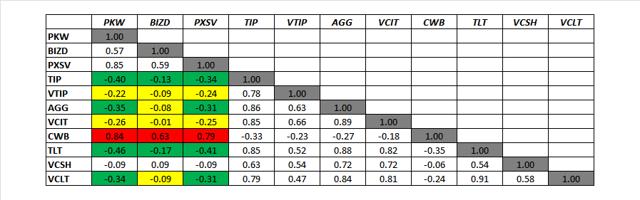
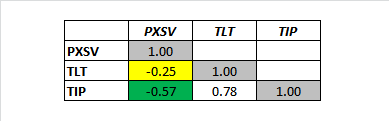
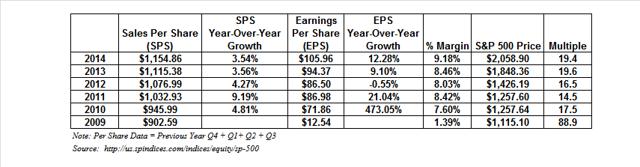
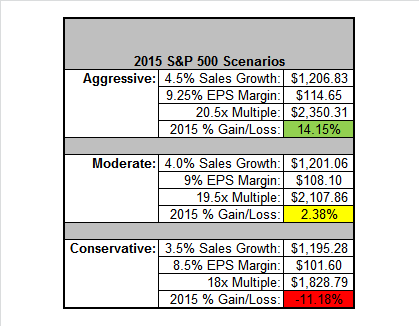 Summary The S&P 500 had another great year with 14% annual return (including dividends). The diversified portfolio only returned 3.6%, held back by Business Development Company ETF. Portfolio yield exceeded the S&P 500 by 118 basis points. Pimco’s BOND ETF was replaced by TLT. TLT chosen based on correlation. S&P 500 Fundamentals need to continue to grow to have a positive 2015 year. Here are the fourth quarter and full-year results of a diversified ETF portfolio. The holding in BOND was replaced with TLT because of a change in my thesis. BOND was included to cover the bond portion of the portfolio because my thesis was that the expertise of Bill Gross would help BOND perform during calendar year 2014. Once Bill Gross quit Pimco, it was time for a change. Q1 Update: Link Q2 Update: Link Q3 Update: Link MARKET PERFORMANCE The S&P 500, as measured by the Vanguard S&P 500 ETF (NYSEARCA: VOO ), was up 13.97% (including dividends) for CY2014. Not too shabby. (click to enlarge) Eight of the nine sectors were positive for the year. Energy was the one sector that was negative. Technology, health, and utilities all outperformed the S&P 500. The utilities sector was the best performer, up 24.4%, which is usually considered a safe harbor investment. According to my calculations, a portfolio equal weighted in each sector would have returned 11% for the year. Throughout CY2014, bond yields fell. Yields closed the year at 2.2%. There was a significant drop during Q4, which is reflected in the performance of TLT. A drop in yields results in a price increase for the bonds. PORTFOLIO PERFORMANCE For Q4, the portfolio was up 2% while the S&P 500 was up 4.89%. For the year, the portfolio was up 3.62% while the S&P 500 was up 13.97%. PowerShares Buyback Achievers (NYSEARCA: PKW ), PowerShares Fundamental Pure Small Value (NYSEARCA: PXSV ), and the iShares 20+ Year Treasury Bond ETF (NYSEARCA: TLT ) all outperformed the S&P 500 for the quarter. Market Vectors BDC Income ETF (NYSEARCA: BIZD ), Vanguard FTSE Emerging Markets ETF (NYSEARCA: VWO ), and SPDR Barclays High Yield Bond (NYSEARCA: JNK ) all posted negative returns for the quarter. (click to enlarge) For the year, only the Market Vectors BDC Income ETF was down; even with its high dividend yield, it was not able to generate a positive return. No one fund outperformed the S&P 500 for the year. The Buyback Achievers came close and the Small Value fund posted a decent rally at year’s end, along with the Bond ETF. (click to enlarge) Here is the performance of the portfolio for the year: BOND FUND REPLACEMENT Why did I replace PIMCO Total Return ETF with iShares 20+ Year Treasury Bond ETF? The purpose of the bond fund is to give some negative correlation to the portfolio and help smooth out some returns over a long time frame (I know, I am monitoring the portfolio on a quarterly basis). As soon as it was announced that Bill Gross was leaving Pimco, I ran a correlation matrix on several possible bond funds. I used the following funds: iShares TIPS Bond (NYSEARCA: TIP ) Vanguard Short-Term Infl-Prot Secs ETF (NASDAQ: VTIP ) iShares Core Total U.S. Bond Market ETF (NYSEARCA: AGG ) Vanguard Intermediate-Term Corp Bd ETF (NASDAQ: VCIT ) SPDR Barclays Capital Convertible Bond ETF (NYSEARCA: CWB ) iShares 20+ Year Treasury Bond Vanguard Short-Term Corporate Bond ETF (NASDAQ: VCSH ) Vanguard Long-Term Corporate Bond ETF (NASDAQ: VCLT ) Here are the results of the correlation matrix (as of 3-Oct-2014): (click to enlarge) TLT has the largest negative correlation to the three equity funds (PKW, BIZD, and PXSV) and therefore, I choose it as the replacement for BOND. Note: The ETF share price used for the correlation matrix was sourced from Yahoo! Finance. TIP came in a very close second. As an exercise, I took the 10 worst days for PXSV (01-Jan-2014 through 03-Oct-2014) and compared that with TLT and TIP. TIP actually had the least correlation over this time frame. LOOKING FORWARD Last year at this time, I estimated a 10% return for the S&P 500. The S&P 500 outpaced that estimate. I estimated a 4.5% increase in sales per share with an 8.5% EPS margin. The actual sales per share increase was only 3.5%, but the EPS margin was 9.18%, which resulted in an actual EPS of $105.96, as compared with my $99.07 EPS estimate. I estimated a 20.5 multiple but the multiple (for the trailing twelve months) came in at 19.4, still allowing a greater than 10% return for the S&P 500. How about for 2015? I looked at three scenarios below. With the continuing improving employment numbers and the recent robust GDP numbers, I would expect the S&P to return between 2.5% and about 14% for the year. Large range, I know. Looking at the three scenarios below, it does not take much degradation in the fundamentals to get a negative return for the year. I was surprised how easy it would be to get a -11% annual return, using what I would still consider to be some decent fundamental performance. (click to enlarge) Disclosure: The author is long VOO, VWO. (More…) The author wrote this article themselves, and it expresses their own opinions. The author is not receiving compensation for it (other than from Seeking Alpha). The author has no business relationship with any company whose stock is mentioned in this article. Scalper1 News
Scalper1 News