Tag Archives: uso

Is The USDA Right About Cotton?

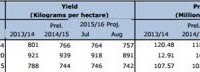
Summary The most recent report shows a 20% decline in production. Crude oil remains near 6 year lows. Global stocks are shrinking, but not by much. October is peak harvesting season for cotton. This article will center around the recent United States Department of Agriculture (USDA) projections on cotton and the subsequent affect that could have on the iPath Dow Jones-UBS Cotton Total Return Sub-Index ETN (NYSEARCA: BAL ). During our last article on BAL, which you can read here , we discussed how oil and cotton shared a correlation. We will revisit that discussion and end with an analysis of current conditions. USDA For the full context of what we are going to discuss in this article, here are the links to the USDA’s August crop production and world markets and trade circulars for cotton. I highly recommend viewing the links as we will not cover the global supply and demand factors in this article (except for a summary in the conclusion). (click to enlarge) Chart obtained from the USDA. The above chart explains the recent increase in cotton prices. United States production is projected to be down almost 20% over last year. The keyword I want to highlight here is projected. See below for a more detailed view of the projections: (click to enlarge) Chart obtained from the USDA. The reason I was highlighting the word “projected” is because some Texas farmers were on record saying that they believe the numbers for abandonment are way off. These farmers are part of a coalition that represents 60% of the states production. Abandonment is when farmers plant the crop, but do not harvest it due to low market prices or other market conditions. If this had been a farmer from New Mexico, no one would pay attention. However, Texas is the largest state for U.S. cotton production, by a long shot. Earlier this year we discussed how the flooding there delayed the planting but farmers were still expected to get a full harvest in. Bottom line from this report is that yield per acre is down a bit and the number of planted acres is down significantly. The conclusion I come to is that even if Texas farmers have lower abandonment numbers, they will not be able to completely overcome the overall drop in yield and planted acreage. BAL Let’s view the price action of BAL over the last month: (click to enlarge) Chart obtained from Optionshouse.com Here is another view showing the percentage of change: BAL has been hampered by the continuing decline in crude oil prices. See the crude chart below: I have been in the camp that crude oil is going to rebound to about $60 per barrel by the end of the year. I had sold a few Puts on The United States Oil Fund (NYSEARCA: USO ), but bought them back recently for a small loss. Given the current supply and demand factors and market factors, I don’t know if we will see $60 by years end. Saudi Arabia seems bent on eliminating competition, Iran is coming online, U.S. production has not slowed drastically, and demand has not increased substantially. The U.S. dollar is a wild card with a projected Fed liftoff this September. A stronger dollar means additional pressure on oil. How is all of this affecting BAL? Cotton will face continued price pressure from cheap oil. This presents the case more for a ceiling on spot prices than a floor. I suspect it was the lower prices of crude that swayed farmers to plant more profitable crops this year than the lower spot price of cotton. Oils first plunge this year came right before peak planting season for cotton. Conclusion In closing, I believe the USDA’s numbers and projections are more in line with reality than the Texas farmers are leading you to believe. However, if the farmers can obtain a more reasonable rate for their crop, then naturally abandonment will decrease, further increasing supply. The global supply and demand of cotton remains stable. Stocks are still trending lower off of their all-time highs but are still not being reduced enough to make a substantial impact on the spot price of U.S. cotton and in turn BAL. I would use caution with this current spike in spot prices. I do not see this a buy signal. Given the current state of crude prices, I see higher risks to the downside for cotton going forward. I would keep an eye out for the September USDA reports to see if their current projections hold or are revised. If the Texas farmers are correct about the abandonment, then I see higher than projected production and further downward pressure on spot prices. This would have the opposite effect of the nice green candle you see in the chart above. By November, I hope to have a full report out for you on my 2016 outlook for cotton. I see 2016 as a more profitable year for BAL as lower cotton production reduces supply and we finally see a rebound in crude prices. Crude remains a wild card and anything can happen with the flick of a Middle Eastern switch. If you are investing in BAL your current focus should be the monthly USDA reports (and any other production news) and crude. As we enter peak harvesting season for cotton, those monthly reports are very valuable. As always, I appreciate you reading and I hope you have a profitable end to 2015! Disclosure: I/we have no positions in any stocks mentioned, and no plans to initiate any positions within the next 72 hours. (More…) I wrote this article myself, and it expresses my own opinions. I am not receiving compensation for it (other than from Seeking Alpha). I have no business relationship with any company whose stock is mentioned in this article.

USO: A New Way To Think About Your Oil Investments

The surprising plummet in petroleum prices over the past 12 months has caught a lot of people off-guard, and has presented a variety of consequence. For investors, It has created downward pressure on most, but not all petroleum-related equities. For many Americans with less of a vested interest in the matter, the drop has meant a quasi-tax-cut, with a gallon of gas falling from $4-$5 a gallon to something a bit more tolerable. Those employed by the industry may be fearing for their position or may have already been told they are out of work. Foreign economies dependent on oil exporting are vulnerable to economic collapse. The integrated oil giants such as Chevron (NYSE: CVX ), Exxon (NYSE: XOM ), and BP (NYSE: BP ) tend to be core holdings in many long-term portfolios. While perpetual optimists – sometimes referred to as “perma-bulls,” seem steadfast in the view that oil prices will “come back,” I would caution against that assumption. “Forever” investors – those that buy and generally never sell a stock – have no choice but to think in optimistic terms since they, either voluntarily or involuntarily, lock themselves into ownership. The fact of the matter is we don’t know that oil will “come back.” We may never see $100 a barrel oil again in our lifetimes. Near-term we are swimming in a veritable glut of the stuff. Supply imbalance combined with bullish speculator abandonment of petroleum, has created, as is typically in today’s fluid financial markets, a frenzy of attention. OPEC has not helped those looking for a price reprieve and seems keen on keeping production level, and prices low. The price of the United States Oil Fund LP ETF (NYSEARCA: USO ) has fallen 28 percent in six months. Whether you think the price action is justified or not should not be a huge consideration, although a forward thesis can help you keep focus on how your approach energy investment. As an investor you must learn to cope with varying situations. To assume you know what the price of oil will do in the coming months, years, or decades, is foolhardy. Uncertainty of financial markets is why diversification, amongst asset type, sectors, stocks, and investment style is such a strong risk management tool. For some investors, adding to these kinds of stocks may make sense here, for others, taking their lumps and decreasing net exposure to oil may be the proper move. Opportunistic investors should avoid obsession over the decline in oil stocks , instead focusing in on industries that might benefit from prolonged cheap oil. Instead of adding to a position in Exxon, which is being pressured, how about investing in airlines – an industry where fuel is a significant expense. How about cruise lines – again, an industry that sees fuel as a significant input and where tame pricing leads direct to the bottom line. Automakers stand to benefit the longer oil prices stay low . With more disposable income in their pocket, consumers may opt for bigger gas guzzlers that means higher margins for auto companies. How about trucking companies? Get out of the box and start thinking where profits may be soaring. While Exxon has dropped 25% the past year, Southwest Airlines (NYSE: LUV ) has risen 25 percent. That disparity could continue. Don’t short USO, when there’s safer plays that could be just as rewarding out there against an oil collapse. There are certainly other areas in the market where waiting around for something to happen has not been the wisest of bets. For years there have been those thinking that the bond market has been in a bubble. Most of these investors have sat on the sidelines, most likely in cash, waiting for a massive rise in interest rates that has yet to materialize. It may never materialize . As I write this, the 10-Year Treasury sits at 2.15% after briefly brushing up against 2.5 percent. While even I have cautioned against getting too slap happy with long-term bonds – those with bond exposure have earned their coupons without issue, while those who’ve sat in cash have suffered tremendous opportunity cost. Even if the Fed moves to tighten this year, which is starting to seem rather likely, it’s possible that long rates continue their dovish pattern. Who benefits from low rates? Highly levered companies with solid business models that can obtain low cost capital. Again, instead of focusing on when rates will rise, take advantage of what is, and has been, on the table for quite some time now. Might that end tomorrow,? Perhaps. But don’t invest like you absolutely know how things will shake out. Hedge yourself and manage risk. Indeed, leveraging an entire portfolio to one idea can pose disastrous risk. The investor less exposed to energy over the past year or leveraged to ideas premised on falling oil prices (airlines, cruise lines) has made out like a bandit. Your great-grandfather who has pledged absolutely allegiance to oil stocks, not so much. Instead of guessing when things might happen or sitting on an industry or idea that has obvious headwinds, learn to embrace what the economy and financial markets afford you. It’s one thing to be optimistic. It’s another thing to pretend you know more than you really do. Disclaimer: The above should not be considered or construed as individualized or specific investment advice. Do your own research and consult a professional, if necessary, before making investment decisions. Adam Aloisi was long shares of Southwest Airlines, Norwegian Cruise Line, Exxon, and General Motors at time of writing, but positions can change at any time. Link to the original post here

Long-Term ETF Performance

We post the ETF matrix below on a regular basis to highlight short-term movements in various asset classes. But today we’ll take a look at long-term performance: YTD, over the last 3 years, and since the bull market began on March 9th, 2009. Keep in mind that these are simple price returns and don’t include dividend payments. Over the last 3 years, the US Health Care ETF (NYSEARCA: XLV ) is up the most of any ETF in our matrix with a gain of 101.5%. Consumer Discretionary (NYSEARCA: XLY ) is up the second most with a gain of 80%, and the Nasdaq 100 (NASDAQ: QQQ ) ranks third at +77.8%. Not all sectors are up significantly over the last 3 years – the Energy ETF (NYSEARCA: XLE ) is up just 4.39%. And not all ETFs in our matrix are in the green over the last 3 years either. The yen ETF (NYSEARCA: FXY ) is down 37.5%, while Brazil (NYSEARCA: EWZ ) and Russia (NYSEARCA: RSX ) are both down 30%+ as well. Commodities ETFs are also deep in the red across the board, with oil (NYSEARCA: USO ) leading the way lower at -50%. During the current bull market going back to March 2009, the Consumer Discretionary ETF ( XLY ) is up the most at +391.25%. The Nasdaq 100 ( QQQ ) is up 343%), while the S&P 500 (NYSEARCA: SPY ) is up 211.9%. Outside of the US, India (NYSEARCA: INP ) has done the best at +201.9%, followed by Hong Kong (NYSEARCA: EWH ) at 157%. Brazil ( EWZ ) is actually down 5% since 3/9/09. Out of the entire ETF matrix, the UNG natural gas ETF is down the most since 3/9/09 with a decline of 89%. Hopefully you’ve avoided that one! Share this article with a colleague