Scalper1 News

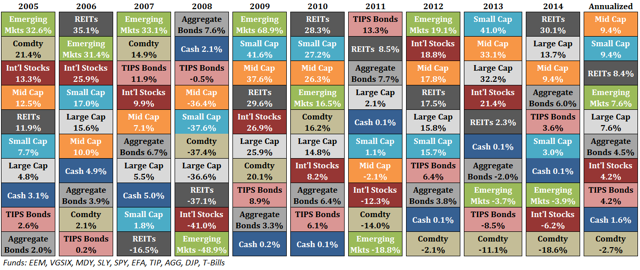
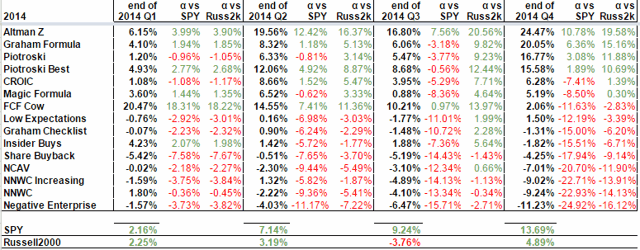
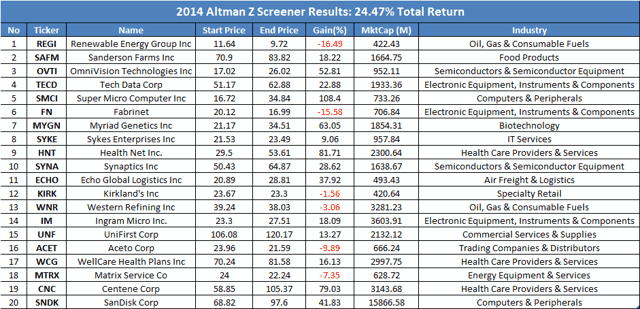
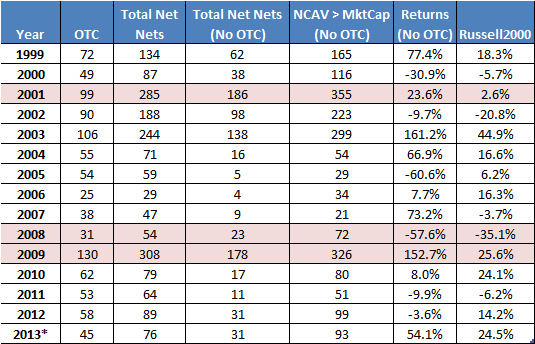 Summary 2014 was a tough year in the markets but there was a strategy that outperformed the market with a gain of 24.5%. Quarterly breakdown of results for the 15 different value investing strategies I follow are provided. A detailed look at the stock portfolio that outperformed in 2014. In ancient Roman mythology, there is a god with two faces. His name is Janus, and with two faces, he looks in both directions representing the past and future. It’s also where the word January came from. Although January 2015 is fully under way, it’s appropriate because we are still at a stage of looking back at 2014, while also looking at what lies ahead in 2015. Now one of the very last tasks of the year (or first of the year) that I do is to go through all the performances of the value stock screeners and see what worked and what didn’t. I don’t bother with gathering results for all different asset classes and sectors because there are plenty of people who are better than me at this. It’s easier to leverage the work of others and to put my value strategies into context. Here’s the best chart I came across showing the performance of the major asset classes. (click to enlarge) Yearly Asset Performance Chart (Credit: awealthofcommonsense.com ) Because my focus has always been on value stocks, the stocks shown on the value screens all fall into the large, mid and small cap boxes above. But most of those stocks should be categorized into the small cap group which managed 3% on the year. So in the grand scheme of things, no matter how good the strategy or quality of the company was, small caps had a rough 2014. It goes to show how difficult it is to beat the market. The market isn’t going to award you easily just because the company has strong fundamentals. What works one year, may not the next and it’s a test of conviction and temperament to see it through. That’s why having a clear process to buy and sell stocks and to focus on creating long term wealth is important over short-term gains. Sure it feels good when you beat the market, but that’s something you can leave to fund managers who are judged based on their quarterly or yearly results. You and I have the luxury of looking 5 or 10 years down the road and comparing performance then. A few bad years after having achieved 200% vs. the market’s 100% over a 10-year period isn’t important. The end goal is to outperform the market over the long run because you aren’t trying to invest for a few months and then call it quits. With that in mind, here are the final 2014 results for each of the Value Screeners . 2014 Value Screener Results Before getting into the results, a very common question that I receive daily is whether the OSV Analyzer will screen for stocks and tell people what to buy and sell. I want to start by clearing up that these strategies are not created with the OSV Analyzer. The OSV Analyzer is a deep fundamental analysis and valuation tool. A tool to drill down deeply into a single company quickly instead of just scratching the surface and looking at basic stats. Screening will come in the future. With that out of the way, here are the results. (click to enlarge) Out of 15 value strategies, only 4 managed to outperform the market at the end of the year. The outperforming strategies ( Altman , Graham , Piotroski ) were the ones that contained a lot of mid and large caps. With the Altman Z value screen leading the pack this year, here’s a look at the 20 stocks that made up the list from the beginning of the year and how each performed. (click to enlarge) There are stocks that I definitely wouldn’t purchase, but that’s the beauty of mechanical investing. It’s simplified down to how well you create a strategy and stick with it. This reduces many of the variables that go into individual stock picking. However, I still find it difficult to give up total control of my portfolio. I prefer to further filter the list with my analyzer because screeners still make mistakes. Manual analysis is also required because there are things like off balance sheet items screens can’t recognize and qualitative events that can’t be simulated. But if this was something that I want to follow with real money, I’ll want to create a new account with at least $20k instead of using money from my existing portfolio. Not the Time to Invest in US Net Nets One sure thing about 2014 was that it wasn’t a good year for net nets. It’s especially clear looking at the Net Net performance. Since the results are all US listed stocks, the horrible performance isn’t surprising. When markets are hot, stay away from employing a pure USA net net investing strategy. You need to expand to international net nets if you want to stick with Graham’s net nets. But right now, there aren’t many US net nets that you should be investing in. The ones you see floating around the stock market have serious issues. The official screeners identified around 5-6 stocks at the start of the year and the minimum that I test with is always 20 stocks. For any mechanical strategy where you have to trust the theory and the system, holding 5-6 stocks is going to get you killed. The full 20 stocks are required for the portfolio to be diversified enough for each strategy to work over the long run. As I showed previously , when the number of net nets increase, it’s definitely a sign that the market is getting cheaper and that’s the time to be loading up on good net nets. Just not now. In the next post, I’ll be listing the official stocks for each screen that will be tracked for 2015. It features a list of 225 value stocks you can download and to get ideas. Scalper1 News
Scalper1 News