Scalper1 News
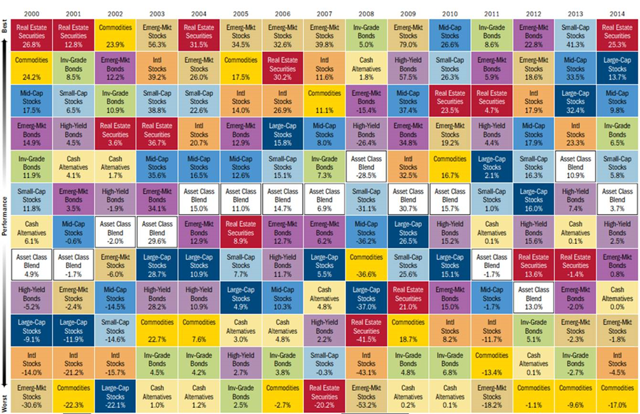
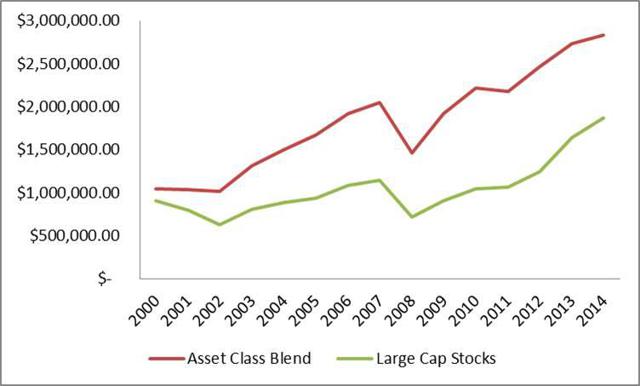 Summary The S&P 500 and the Dow are often quoted on TV and by various media outlets when providing updates on the stock market. By doing this, the media is implicitly suggesting to investors that these indexes represent how the market is actually performing. Trouble is that not everyone has the same definition of “the market” and not every investor has a portfolio that is structured like “the market” – and probably for good. Benchmarks to gauge the performance should be consistent with actual portfolio strategies as opposed to using a widely recognized stock market index, such as the S&P 500 index. Far too often, individual investors measure the success of their investment portfolios, or the effectiveness of their financial advisors, relative to the performance of a well-known stock market index such as the S&P 500 Index (“S&P 500”) or the Dow Jones Industrial Average Index (“Dow”). While it is important for investors to have a tool to measure the success of an investment strategy against, it can be very misleading, and often misguided, if an investor chooses an index as their tool that is not consistent with their risk tolerance or investment objectives. For example, the S&P 500 and the Dow are often quoted on TV and by various media outlets when providing updates on the stock market. By doing this, the media is implicitly suggesting to investors that these indexes represent how the market is actually performing. Trouble is that not everyone has the same definition of “the market” and not every investor has a portfolio that is structured like “the market” – and probably for good reason . In an Investment News article entitled, ” When underperforming the S&P 500 is a good thing ” (sign-up required), author Jeff Benjamin claims that investors have become programmed to dwell on the performance of a few high-profile benchmarks. Benjamin goes on to state that, “…a truly diversified investment portfolio should have returned less than 5% in 2014. It was that kind of year. Any advisor who generated returns close to the S&P was taking on way too much risk, and should probably be fired.” The suggestion of having the financial advisor fired may be extreme, especially if an investor has instructed their advisor to build a portfolio to try and provide performance consistent with, or superior to, the S&P 500 ( or the Dow ) and recognizes the potential risk associated with that type of strategy. However, most investors do not have this large of a risk appetite and appreciate the benefits of diversification to help deal with market volatility if and when it occurs. To this end, many of the growth-oriented investors that we speak with at Hennion & Walsh are interested in portfolios that are managed to help deliver a reasonable return while also providing for some downside protection. As a result, investors generally do not have that large of a percentage of their portfolio assets allocated to the one asset class associated with these two stock market indexes. This asset class is U.S. Large Cap. To this end, Michael Baker of Vertex Capital Advisors stated in the same previously mentioned article that, “The S&P 500 really just represents one asset class – large cap stocks…and most investors only have about 15% allocated to large cap stocks.” Having all of their investment portfolios allocated to one single asset class, such as U.S. large cap, would have rewarded investors well since the last major market crash hit bottom in March of 2009. However, this does not mean that this will always be the case going forward nor has it been the case historically. The chart below from First Clearing shows the annual returns of several asset classes from 2000 to 2014. A quick review of this chart will show how well U.S. large cap stocks have performed since 2009. Since the media focuses on U.S. large cap indexes, investors have thus been constantly reminded of how well “the market,” or more specifically U.S. large cap stocks, has done for the past 5 years. By further reviewing this chart, however, investors are also reminded that this is not always the case. U.S. large cap stocks suffered significant losses in 2008 and 2002 and additional losses in 2000 and 2001. Additionally, while large cap stocks finished in the top half of asset class performance in each of the past four years, they have only achieved this ranking once over the eleven years prior to 2011. Asset Class Returns (2000 – 2014) (click to enlarge) Source: First Clearing, LLC, 2015. Asset allocation cannot eliminate the risk of fluctuating prices and uncertain returns. Past performance is not indicative of future results. This chart is provided for illustrative purposes only and is not indicative of any specific investment. Asset class performance data based on representative indexes. You cannot invest directly in an index. Individual investment results will vary. The data assumes the reinvestment of all income and dividends and does not account for taxes and transaction costs. On the other hand, this chart attempts to illustrate the value of asset allocation with the asset class box named “Asset Class Blend” which is simply an equal weighting of all of the asset class indexes included on the chart. While I am not suggesting that such a blend is appropriate for all investors or all market environments and would likely include more asset classes and sectors to make the chart more comprehensive, the results shown in this chart still certainly demonstrate the potential benefits of diversification in down and/or volatile markets. Not inclusive of the potential fees for the implementation of each respective strategy or associated tax implications, $1,000,000 invested in large cap stocks in 2000 would have been worth $1,866,218 at the end of 2014. Conversely, the same $1,000,000 invested in this particular asset class blend strategy in 2000 would have been worth $2,831,257 at the end of 2014 based upon the annual returns listed in this Asset Class Returns table. $1,000,000 Investment Comparison from 2000 – 2014 (click to enlarge) Data source: Asset Class Returns (2000 – 2014) chart shown above in this post . Chart source: First Clearing, LLC, 2015. Asset allocation cannot eliminate the risk of fluctuating prices and uncertain returns. Past performance is not indicative of future results. This chart is provided for illustrative purposes only and is not indicative of any specific investment. Asset class performance data based on representative indexes. You cannot invest directly in an index. Individual investment results will vary. The data assumes the reinvestment of all income and dividends and does not account for taxes and transaction costs. As a result, it is imperative that investors are honest with themselves about their true tolerance for risk. If they are truthful to themselves, their risk appetite should not change based upon the current directional performance of “the market.” If an investor is not comfortable assuming the risk of “the market” or a single asset class, such as U.S. large cap, in all market environments, then they should consider the following: 1. Building ( or maintaining ) a diversified portfolio, incorporating a variety of asset classes and sectors, consistent with their tolerance for risk, investment timeframe and financial goals. 2. Utilize a benchmark to gauge the performance of their investment strategy that is consistent with (1) above as opposed to using a widely recognized stock market index, such as the S&P 500, that may not be relevant, and is likely very unhelpful, to them. 3. Try to not make critical portfolio decisions based on short term performance results but rather consider longer term performance results relative to their own overall financial goals. 4. Avoid the temptation of being influenced by media reports on general market performance to measure the success of their own investment portfolios, or the effectiveness of their respective financial advisors. Disclosure: The author has no positions in any stocks mentioned, and no plans to initiate any positions within the next 72 hours. (More…) The author wrote this article themselves, and it expresses their own opinions. The author is not receiving compensation for it. The author has no business relationship with any company whose stock is mentioned in this article. Scalper1 News
Scalper1 News