Scalper1 News
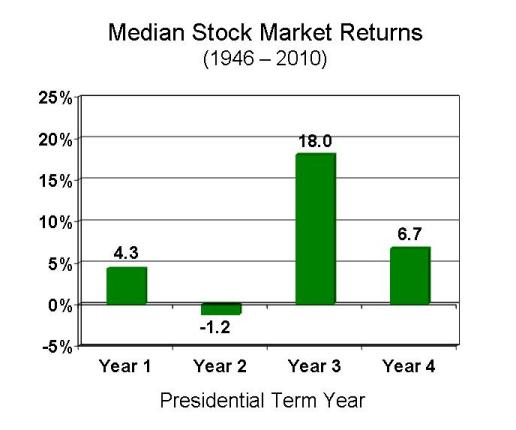
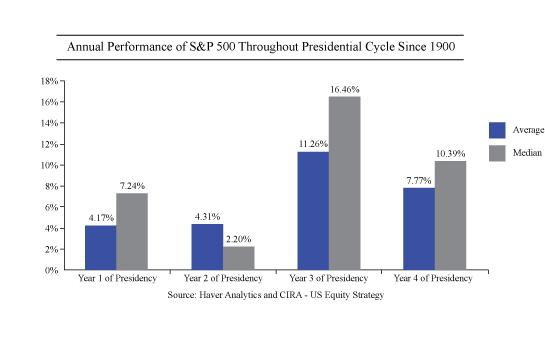
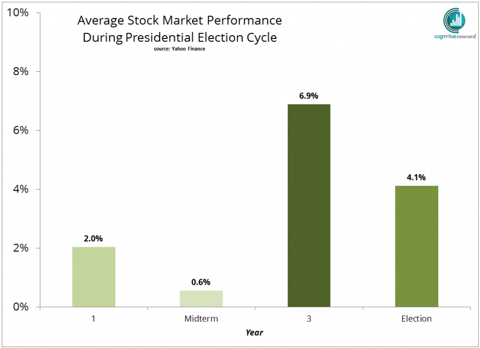
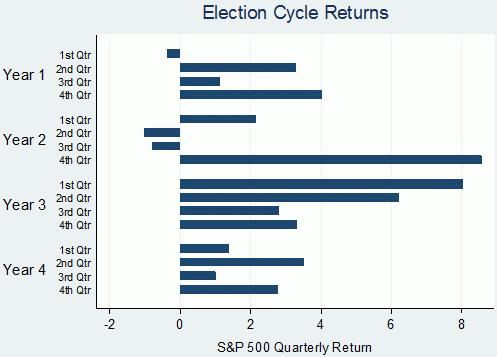
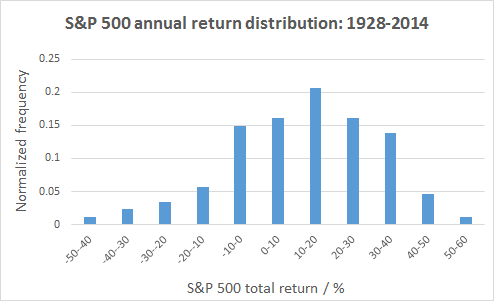
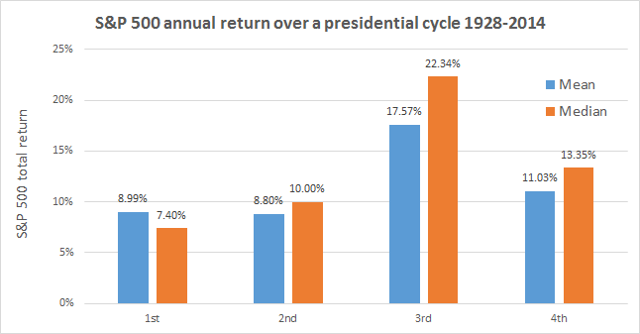
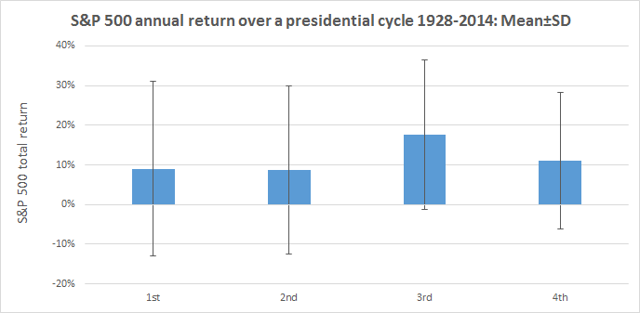 Summary The third year of a presidential cycle has historically offered outsized returns. In this study, data for 1928 to 2014 were analyzed to evaluate the effect of the presidential cycle on S&P 500 performance. Given that we are currently in Obama’s third year (of his second term), should we be expecting significant gains ahead? Introduction In a previous article entitled ” The January Effect Revisited And A Call For The Use Of Elementary Statistics “, I made the case that assertions of outperformance should be supported by elementary statistics. In the case of the January effect, I analyzed monthly data from 1988 to 2014 to show that the standard deviation of monthly returns was actually very large compared to the average return for any given month, rendering most of the observed seasonal deviations to be statistically insignificant. Yet, the absence of error bars on the most popular graphs illustrating the January effect means that investors studying the chart would be unable to ascertain whether [i] the outperformance is statistically significant and [ii] whether or not the increased return is worth the risk. The article ended with an exhortation for all analysts to incorporate simple statistical analysis into their charts. In the present article, we analyze another phenomenon that may be playing out at the present time: the impact of the presidential cycle (also known as the election cycle) on stock market performance. The following charts are top hits in a Google search for “presidential cycle stock market”. (Source: GoBankingRates ) (Source: Murray Financial Group ) (Source: Seeking Alpha ) (Source: John Rothe ) All four charts show the 3rd year of a president’s term to be the best in terms of stock market performance, and the 2nd year to be the worst. Interestingly, the last chart seems to show that the final quarter of the 2nd year actually delivers the best performance out of all 16 quarters in the presidential cycle. Now, what are all four charts missing? If you had read the previous article (or the introduction) you would know that the answer is “error bars”. Given that we are currently in the 3rd, and presumably “best”, year of Obama’s presidency (the second term), I was interested to determine whether or not the presidential cycle has a statistically significant impact on stock market performance. Results and discussion Yearly total return performance for S&P 500 (NYSEARCA: SPY ) from 1928 to 2014 was obtained from Aswath Damodaran . For the purposes of this study, the four-year presidential cycle is assumed to occur continuously even though there have been interruptions with certain presidents. For example, Gerald Ford’s first year in the office in 1974 would still be counted as the second year of the presidential cycle (since it would have been Richard Nixon’s 6th year in office). The S&P 500 annual total return distribution from 1928 to 2014 shows a bell-like shaped curve with a negative skew, from which the dreaded “left tail” can be observed. Yet, it should be noted that 63 out of the 87 years (or 72.4%) in this study have had positive returns. The average return over the 87 years was 11.53%, while the median return was 14.22%. This is one reason why “buy-and-hold” has worked so well for the average investor in the U.S. market. First let’s have a look at the average performance of the stock market over the four-year presidential cycle. (click to enlarge) Consistent with the charts presented in the introduction, we find that the 3rd year of the presidential cycle provides the greatest performance, with an average performance of 17.57% (and median of 22.34%). Moreover, the 3rd year was the only year that outperformed the average overall return of 11.53% (and median of 14.22%). The other three years all underperformed the average, with the 2nd year having the lowest return of 8.80% (and median of 10.00%), again consistent with previous charts. The next chart shows the data for average returns but with the inclusion of error bars representing the standard deviation of the results. (click to enlarge) We see that the standard deviation of the annual returns is larger than the actual returns (though not overwhelmingly so), indicating significant variability in the results. One way to visualize these error bars is to assume that about 68% (or just over two-thirds) of the data points lie between the error bars. A t-test was conducted to investigate whether or not the annual returns of each year of the presidential cycle is significantly different from the overall average return of 11.53%. The results are shown in the table below. 1st 2nd 3rd 4th Mean 8.99% 8.80% 17.57% 11.03% Standard deviation 22.01% 21.21% 18.90% 17.20% p-value 0.594 0.553 0.158 0.893 Significant? No No No No The results of the t-test show that none of the years of the presidential cycle are significantly different from the average year. A number of commenters in the previous article mentioned that because the return distribution is not exactly normal (there is some skewness or kurtosis), an alternative test such as the Wilcoxon test should be performed. Therefore, I also calculated the p-value using the one-sample Wilcoxon signed-rank test to determine whether the median returns for each year of the presidential cycle was significantly different from the overall median return of 14.22%. 1st 2nd 3rd 4th Median 7.40% 10.00% 22.34% 13.35% p-value p> 0.10 p> 0.10 p> 0.10 p> 0.10 Significant? No No No No Similarly, the one-sample Wilcoxon signed-ranked test shows that none of the observed performances were significant. (It is noted that the Wilcoxon test assumes a symmetrical distribution, which is not perfectly valid for the present distribution. I considered the one-sample sign test, but that test does not capture the magnitude of differences from the median. If anyone knows another simple one-sample, non-normal, non-symmetric test that can be used instead, please let me and the readers know!) C onclusion While the 3rd year of a presidential term has delivered, on average, outsized returns for the past 87 years (from 1928 to 2014), any deviations between any of the years of the presidential cycle and the average or median return were found to be insignificant. Note that statistical tests such as these do not “disprove” the presidential cycle effect, nor do they prevent you from profiting (or attempting to profit) from the perceived opportunity. What the tests do tell you is that for the past 87 years, any impact that the presidential cycle has had on stock market returns is indistinguishable from chance. Therefore, this article ends with another call for analysts to incorporate simple statistical analysis into their presentations. This information would allow investors to evaluate [i] whether the outperformance is statistically significant and [ii] whether or not the increased return is worth the risk. Author’s note: On a personal level, I was rather disappointed in the outcome of this study. Given that we are currently in the 3rd year of the presidential cycle, I was really hoping that the effect would be significant. I guess that’s confirmation bias creeping in! Scalper1 News
Scalper1 News