Scalper1 News
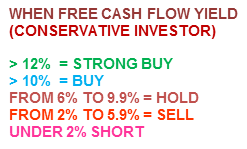
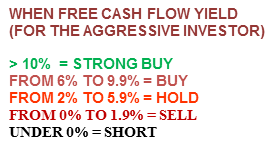
 Analysis of the S&P 500 Index and its individual components using the “Free Cash Flow Yield” ratio. Specifically written to assist those Seeking Alpha readers who are using my free cash flow system. Generates a final result for the S&P 500 Index and explains that result to each reader depending an what type of investor they are. Back in December of last year, I introduced my free cash flow system here on Seeking Alpha, through a series of articles that you can view by going to my SA profile . My purpose in doing so was to try and teach as many investors as I could, on how to do this simple analysis on their own, as I believe in the following: “Give a person a fish and you feed them for a day, Teach a person to fish and you feed them for life” I have been very pleased with the positive feedback that I have received so far, but included in that feedback were many requests by those using my system, to see if they did their analysis correctly or not. Since the rate of these requests has been increasing with every new article I write, I have decided to start a new series of articles here on Seeking Alpha analyzing the S&P 500 Index, where I will analyze each of its components individually. That way those of you using my system will have something like a “teacher’s edition” that will give you all the correct calculations for each component. Obviously I can’t include the results for all my ratios in one article, so I will thus be doing a series of articles, where each ratio’s results for the S&P 500 Index will have its own article devoted to it. Hopefully these articles can be used as reference guides that everyone can use over and over again, whenever the need arises. Having said that, at the same time we will be “killing two birds with one stone” as we will also be analyzing the S&P 500 Index and give one final result for it as well as its individual components . That way these series of articles will also be able to give us a real time analysis of whether the S&P 500 Index is attractively priced or overvalued. In order to save space in this article (as the table that will soon follow is quite long) I would welcome everyone to read my article on how to analyze a portfolio/Index by clicking on the following link first: Warren Buffet s Berkshire Hathaway Portfolio: A Free Cash Flow Analysis That way those of you who are new to this analysis will get a complete introduction and for others already familiar with my work, let it act as a refresher course. This article with concentrate on my “Free Cash Flow Yield Ratio” Free Cash Flow Yield = Free Cash Flow per Share / Stock Market Price One key point to always remember in using this system, is that it is designed for all kinds of investors, whether you would be conservative (like I am) or a more aggressive/buy & hold investor. I have created the following parameters for each type and they are as follows: Finally it is also important to understand that I personally do not invest in financial firms as a rule, because it is quite difficult to get a very accurate free cash flow result. This is so because financial firms generate very little in the way of capital expenditures, thus the results you find below are basically just cash flow from operations. I still analyze them as they are part of the S&P 500 Index, but again I don’t invest in them as I find financial firms too complicated to analyze. This belief of not investing in financials, saved me from suffering the huge losses that this sector suffered in 2008-2009, which cost investors dearly. For those who disagree we can start a discussion on the matter in the comment section below, which will allow me to further elaborate on the matter. So without further ado here is my “Free Cash Flow Yield Analysis of the S&P 500 Index (NYSEARCA: SPY ) and its components: (click to enlarge) The final free cash flow yield result of 5.11% for the S&P 500 Index would be classified as a ” Strong Hold” for the more aggressive/ buy & hold investor and a “Weak Sell” for the more conservative investor, using the parameter tables I included at the beginning of the article . The weightings that you see in the index were generated by mirroring those used in the SPDR S&P 500 ETF . Also remember that the results shown above are just for one ratio and that this is not investment advice, but just the results of the ratio. The system outlined in this article and all that will follow, as part of this series, are just meant to be used as reference material to be included as just “one” part of everyone’s own due diligence. So in other words, don’t make investment decisions based on just this one result, but incorporate it as one part of your own due diligence. Scalper1 News
Scalper1 News