Scalper1 News
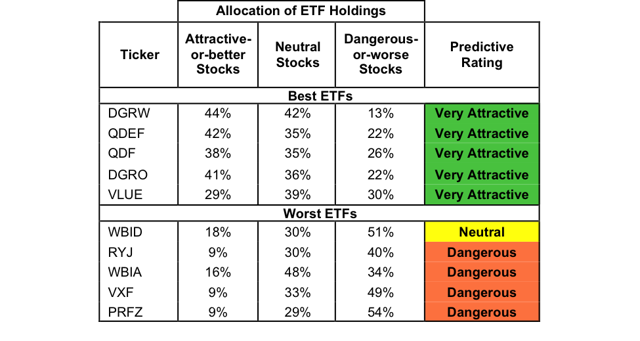
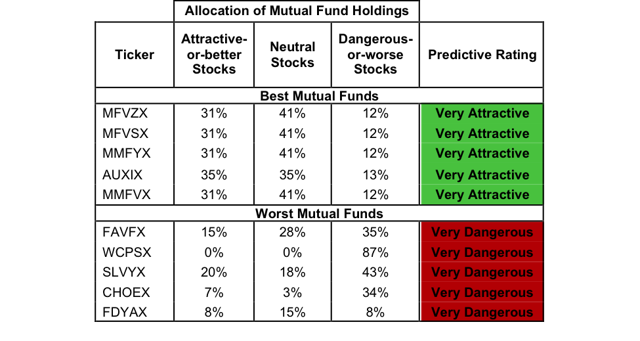
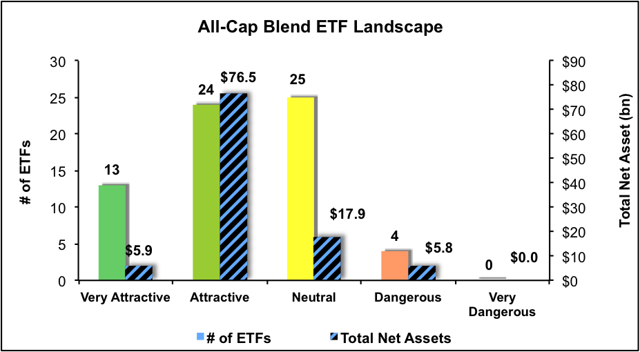
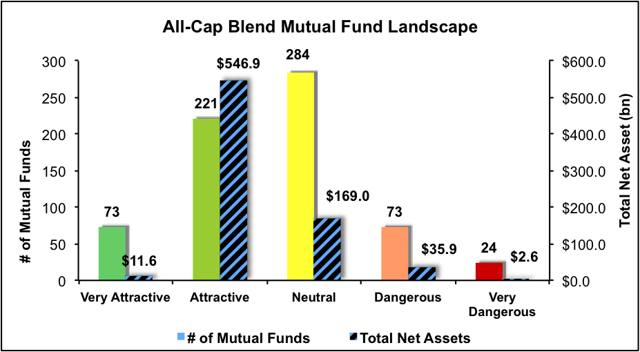 Summary The All Cap Blend style ranks third in Q3’15. Based on an aggregation of ratings of 66 ETFs and 675 mutual funds. DGRW is our top-rated All Cap Blend ETF and MFVZX is our top-rated All Cap Blend mutual fund. The All Cap Blend style ranks third out of the 12 fund styles as detailed in our Q3’15 Style Ratings for ETFs and Mutual Funds report. It gets our Neutral rating, which is based on aggregation of ratings of 66 ETFs and 675 mutual funds in the All Cap Blend style. See a recap of our Q2’15 Style Ratings here. Figure 1 and 2 show the five best and worst-rated ETFs and mutual funds in the style. Not all All Cap Blend style ETFs and mutual funds are created the same. The number of holdings varies widely (from 4 to 3794). This variation creates drastically different investment implications and, therefore, ratings. Investors seeking exposure to the All Cap Blend style should buy one of the Attractive-or-better rated ETFs or mutual funds from Figures 1 and 2. Figure 1: ETFs with the Best & Worst Ratings – Top 5 (click to enlarge) * Best ETFs exclude ETFs with TNAs less than $100 million for inadequate liquidity. Sources: New Constructs, LLC and company filings The ValueShares U.S. Quantitative Value ETF (BATS: QVAL ) is excluded from Figure 1 because its total net assets are below $100 million and do not meet our liquidity minimums Figure 2: Mutual Funds with the Best & Worst Ratings – Top 5 (click to enlarge) * Best mutual funds exclude funds with TNAs less than $100 million for inadequate liquidity. Sources: New Constructs, LLC and company filings The Walden Asset Management Fund (MUTF: WSBFX ) and the Jensen Quality Value Fund ( JNVIX , JNVSX ) are excluded from Figure 2 because their total net assets are below $100 million and do not meet our liquidity minimums. The WisdomTree U.S. Dividend Growth ETF (NASDAQ: DGRW ) is the top-rated All Cap Blend ETF and the MassMutual Select Focused Value Fund (MUTF: MFVZX ) is the top-rated All Cap Blend mutual fund. Both earn a Very Attractive rating. The PowerShares FTSE RAFI US 1500 Small-Mid Portfolio ETF (NASDAQ: PRFZ ) is the worst-rated All Cap Blend ETF and the Forward Dynamic Income Fund (MUTF: FDYAX ) is the worst-rated All Cap Blend mutual fund. PRFZ earns a Dangerous rating and FDYAX earns a Very Dangerous rating. Intel Corporation (NASDAQ: INTC ), is one of our favorite stocks held by All Cap Blend funds and earns our Very Attractive rating. Since 2009, Intel has grown after-tax profit (NOPAT) by 13% compounded annually. Much of this NOPAT growth can be attributed to Intel maintaining NOPAT margins upwards of 18% every year since 2008. The company currently earns a top-quintile return on invested capital ( ROIC ) of 21%, which is a slight improvement from 17% in 2013. Despite the fundamental strength of the business, the stock remains undervalued. At its current price of ~$29/share, Intel has a price to economic book value ( PEBV ) ratio of 0.8. This ratio implies that the market expects Intel’s NOPAT to permanently decline by 20%. If the company can grow NOPAT by just 3% compounded annually over the next ten years , the stock is worth $42/share – a 45% upside. Arbor Realty Trust, Inc. (NYSE: ABR ) is one of our least favorite stocks held by All Cap Blend funds and earns our Dangerous rating. Arbor Realty Trust never quite recovered from the financial crisis in 2008 and NOPAT has declined 55% compounded annually ever since. As opposed to Intel, Arbor Realty Trust has been unable to preserve its once-impressive NOPAT margin of 25% achieved in 2008 as it has since declined to 0.5% in 2014. The market has overlooked the declining nature of the business in favor of focusing on ABR’s 9% dividend yield. To justify its current price of $6/share, Arbor Realty Trust must grow NOPAT 29% compounded annually over the next 17 years . Almost no level of dividend yield can protect investors from the capital loss that would occur if ABR traded at its economic book value of ~$1/share. Figures 3 and 4 show the rating landscape of all All Cap Blend ETFs and mutual funds. Figure 3: Separating the Best ETFs From the Worst Funds (click to enlarge) Sources: New Constructs, LLC and company filings Figure 4: Separating the Best Mutual Funds From the Worst Funds (click to enlarge) Sources: New Constructs, LLC and company filings D isclosure: David Trainer and Max Lee receive no compensation to write about any specific stock, style, style or theme. Disclosure: I/we have no positions in any stocks mentioned, and no plans to initiate any positions within the next 72 hours. (More…) I wrote this article myself, and it expresses my own opinions. I am not receiving compensation for it. I have no business relationship with any company whose stock is mentioned in this article. Scalper1 News
Scalper1 News