Scalper1 News
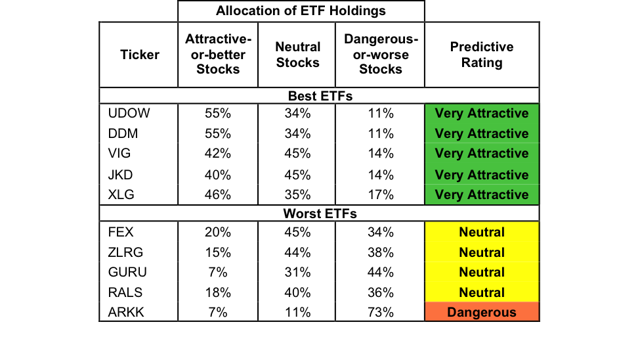
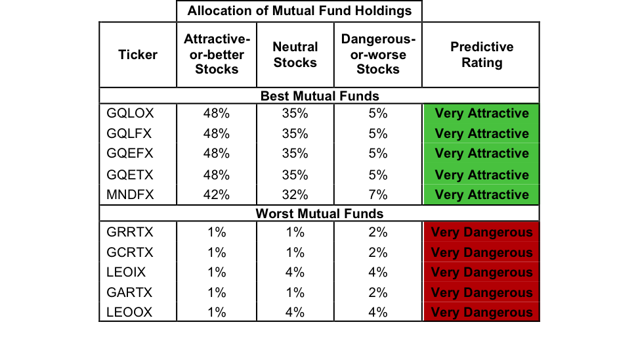
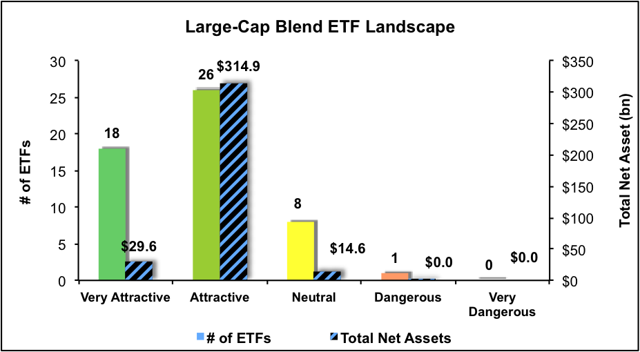
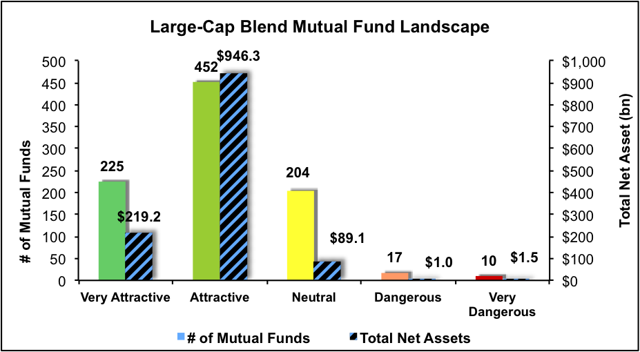 Summary Large Cap Blend style ranks second in 2Q15. Based on an aggregation of ratings of 53 ETFs and 908 mutual funds. UDOW is our top rated Large Cap Blend ETF and GQLOX is our top rated Large Cap Blend mutual fund. The Large Cap Blend style ranks second out of the 12 fund styles as detailed in our 2Q15 Style Ratings report . It gets our Attractive rating, which is based on aggregation of ratings of 53 ETFs and 908 mutual funds in the Large Cap Blend style. Figures 1 and 2 show the five best and worst rated ETFs and mutual funds in the style. Not all Large Cap Blend style ETFs and mutual funds are created the same. The number of holdings varies widely (from 15 to 1364). This variation creates drastically different investment implications and, therefore, ratings. Investors seeking exposure to the Large Cap Blend Style should buy one of the Attractive-or-better rated ETFs or mutual funds from Figures 1 and 2. Figure 1: ETFs with the Best & Worst Ratings – Top 5 (click to enlarge) * Best ETFs exclude ETFs with TNAs less than $100 million for inadequate liquidity. Arrow QVM Equity Factor ETF (NYSEARCA: QVM ) IS excluded from Figure 1 because its total net assets are below $100 million and do not meet our liquidity minimums. Figure 2: Mutual Funds with the Best & Worst Ratings – Top 5 (click to enlarge) * Best mutual funds exclude funds with TNAs less than $100 million for inadequate liquidity. ProShares UltraPro Dow30 ETF (NYSEARCA: UDOW ) is our top-rated Large Cap Blend ETF and GMO Quality Fund (MUTF: GQLOX ) is our top-rated Large Cap Blend mutual fund. Both earn a Very Attractive rating. One of our favorite stocks held by Large Cap Blend funds is Johnson & Johnson (NYSE: JNJ ). In 2014, Johnson & Johnson earned an after-tax operating profit ( NOPAT ) of almost $17 billion; its highest ever in our model. The company has been very consistent over the last decade with regard to its financial performance. NOPAT has grown by 8% compounded annually since 2004 and Johnson & Johnson’s return on invested capital (NASDAQ: ROIC ) has also remained above 14% every year over the last decade. This consistency has allowed the company to continually increase economic earnings every year over this same time frame. Despite the growth in the business, the stock is currently undervalued. At its current price of $98/share, JNJ has a price to economic book value (PEBV) ratio of 1.0. This ratio implies the market expects Johnson & Johnson’s NOPAT to never grow from current levels. Meanwhile, if Johnson & Johnson can grow NOPAT by 7% compounded annually for the next 5 years , the company is worth $140/share- a 43% upside from current levels. These expectations could be easily surpassed given the company’s long and consistent history of generating shareholder value. Ark Innovation ETF (NYSEARCA: ARKK ) is our worst-rated Large Cap Blend ETF and Lazard Enhances Opportunities Portfolio (MUTF: LEOOX ) is our worst-rated Large Cap Blend fund. ARKK earns a Dangerous rating and LEOOX earns a Very Dangerous rating. One of the worst stocks held by Large Cap Blend funds is recent Danger Zone stock Athenahealth (NASDAQ: ATHN ). Over the last three years many of the key financial metrics of the company have deteriorated. Athenahealth’s ROIC has declined from 14% in 2011 to just 1% in 2014. NOPAT has also had a very similar path, declining 42% compounded annually since 2011. In addition, for the past three years, Athenahealth’s cost of capital ( WACC ) has exceeded its ROIC. This has caused the company to earn negative economic earnings and is an indication that the company is destroying shareholder value. Athenahealth’s stock price, however, has not reflected the fundamental deterioration of its underlying business. Since going public in 2007, the stock price has more than tripled. However NOPAT for Athenahealth has declined by 50% since 2007. To justify its current price of $117/share, the company would need to grow NOPAT 60% compounded annually for the next 11 years . This seems very optimistic considering the declining business operations as described above Figures 3 and 4 show the rating landscape of all Large Cap Blend ETFs and mutual funds. Figure 3: Separating the Best ETFs From the Worst Funds (click to enlarge) Figure 4: Separating the Best Mutual Funds From the Worst Funds (click to enlarge) Sources: Figures 1-4: New Constructs, LLC and company filings D isclosure: David Trainer owns JNJ. David Trainer and Allen L. Jackson receive no compensation to write about any specific stock, style, style or theme. Disclosure: The author is long JNJ. (More…) The author wrote this article themselves, and it expresses their own opinions. The author is not receiving compensation for it. The author has no business relationship with any company whose stock is mentioned in this article. Scalper1 News
Scalper1 News