Scalper1 News
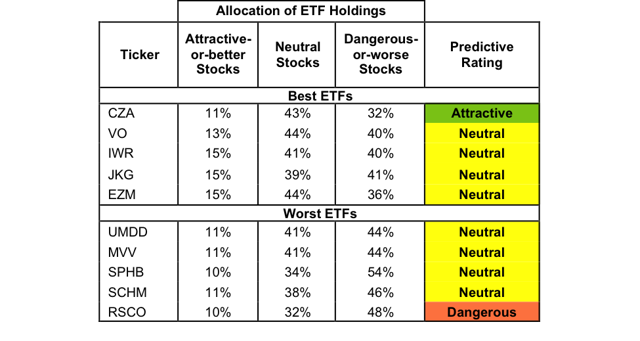
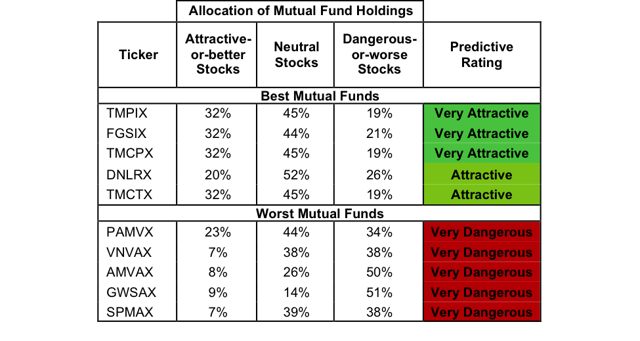
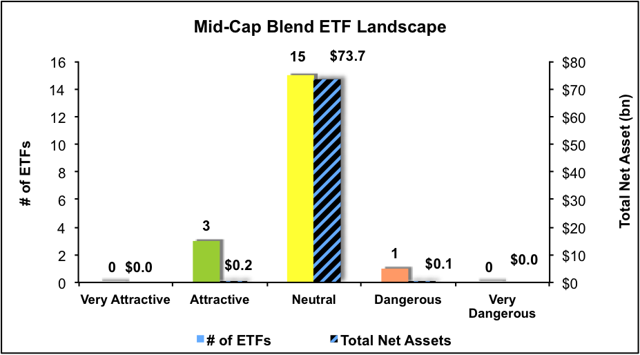
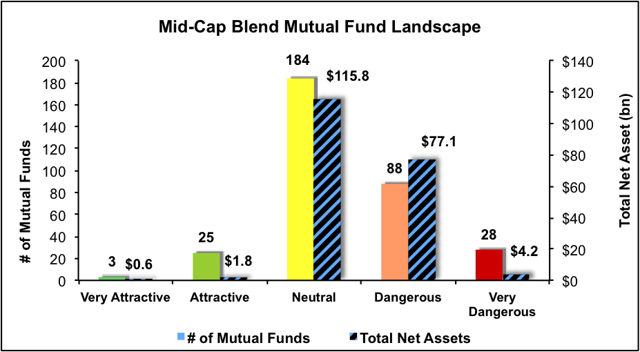 Summary Mid Cap Blend style ranks ninth in 2Q15. Based on an aggregation of ratings of 19 ETFs and 328 mutual funds. CZA is our top rated Mid Cap Blend ETF and TMPIX is our top rated Mid Cap Blend mutual fund. The Mid Cap Blend style ranks ninth out of the 12 fund styles as detailed in our 2Q15 Style Ratings report . It gets our Dangerous rating, which is based on an aggregation of ratings of 19 ETFs and 328 mutual funds in the Mid Cap Blend style. Figures 1 and 2 show the five best and worst rated ETFs and mutual funds in the style. Not all Mid Cap Blend style ETFs and mutual funds are created the same. The number of holdings varies widely (from 25 to 3264). This variation creates drastically different investment implications and, therefore, ratings. Investors seeking exposure to the Mid Cap Blend style should buy one of the Attractive-or-better rated ETFs or mutual funds from Figures 1 and 2. Figure 1: ETFs with the Best & Worst Ratings – Top 5 (click to enlarge) * Best ETFs exclude ETFs with TNAs less than $100 million for inadequate liquidity. Validea Market Legends (NASDAQ: VALX ) and ProShares S&P MidCap 400 Dividend (NYSEARCA: REGL ) are excluded from Figure 1 because their total net assets are below $100 million and do not meet our liquidity minimums. Figure 2: Mutual Funds with the Best & Worst Ratings – Top 5 (click to enlarge) * Best mutual funds exclude funds with TNAs less than $100 million for inadequate liquidity. Johnson Mutual Funds Opportunity Fund (MUTF: JOPPX ) is excluded from Figure 2 because its total net assets are below $100 million and do not meet our liquidity minimums. Guggenheim Mid-Cap Core (NYSEARCA: CZA ) is our top-rated Mid Cap Blend ETF and Touchstone Mid Cap Fund (MUTF: TMPIX ) is our top-rated Mid Cap Blend mutual fund. CZA earns our Attractive rating and TMPIX earns our Very Attractive rating. The Progressive Corp. (NYSE: PGR ) is one of our favorite holdings of Mid Cap Blend ETFs and mutual funds, despite being a large cap stock. Progressive earns our Attractive rating. Since 1998, Progressive has grown after-tax profit ( NOPAT ) by a steady 7% compounded annually. Progressive also boasts a top-quintile return on invested capital ( ROIC ) of 22%. The company counts rising economic earnings and strong free cash flow among its many other strong points. At ~$28/share, PGR trades at a price to economic book ( PEBV ) ratio of only 0.9. This valuation implies that Progressive’s NOPAT will permanently decline by 1c0% from current levels. However, if Progressive can grow NOPAT by just 5% compounded annually for the next five years , the stock is worth $41/share today — a 46% upside. Russell Small Cap Completeness ETF (NYSEARCA: RSCO ) is our worst rated Mid Cap Blend ETF and Saratoga Advantage Mid Cap Portfolio (MUTF: SPMAX ) is our worst rated Mid Cap Blend mutual fund. RSCO earns our Dangerous rating and SPMAX earns our Very Dangerous rating. One of the worst stocks held by Mid Cap Blend ETFs and mutual funds despite being a small cap stock, is Black Diamond Inc. (NASDAQ: BDE ). Black Diamond earns our Very Dangerous rating. In 2014 the company earned a negative NOPAT of $4 million, the company’s worst single year in our model. This negative NOPAT is particularly alarming since it represents the third consecutive year of declining NOPAT. Compounding this issue is Black Diamond’s value destroying -2% ROIC. Black Diamond’s economic earnings have also been negative for five consecutive years. Despite the poor financial state of the company, the stock has risen to unwarranted values and is now awfully overvalued. To justify its current price of ~$10/share, Black Diamond would need to achieve positive NOPAT margins (-2% in 2014) and grow revenue by 29% compounded annually for the next 16 years . With revenue growth below these expectations and actually declining in 2014, there remains significant downside risk in BDE shares. Figures 3 and 4 show the rating landscape of all Mid Cap Blend ETFs and mutual funds. Figure 3: Separating the Best ETFs From the Worst ETFs (click to enlarge) Figure 4: Separating the Best Mutual Funds From the Worst Funds (click to enlarge) Sources Figures 1-4: New Constructs, LLC and company filings Disclosure: David Trainer owns PGR. David Trainer and Allen L. Jackson receive no compensation to write about any specific stock, style, style or theme. Disclosure: I am/we are long PGR. (More…) I wrote this article myself, and it expresses my own opinions. I am not receiving compensation for it. I have no business relationship with any company whose stock is mentioned in this article. Scalper1 News
Scalper1 News