Scalper1 News
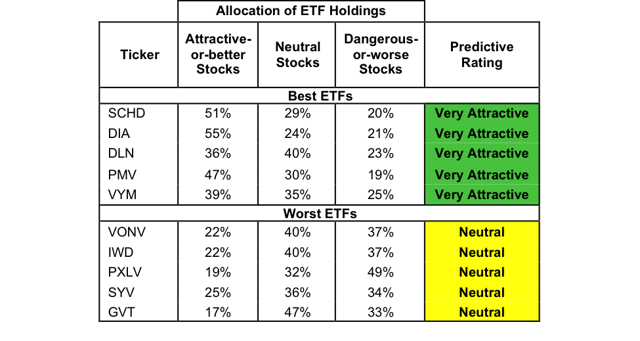
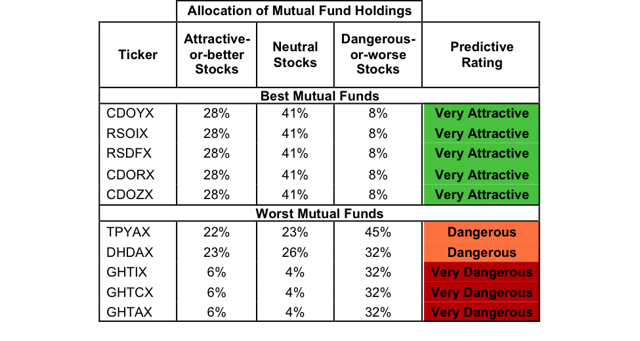
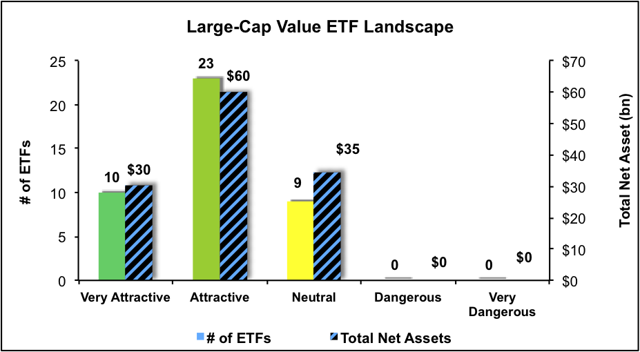
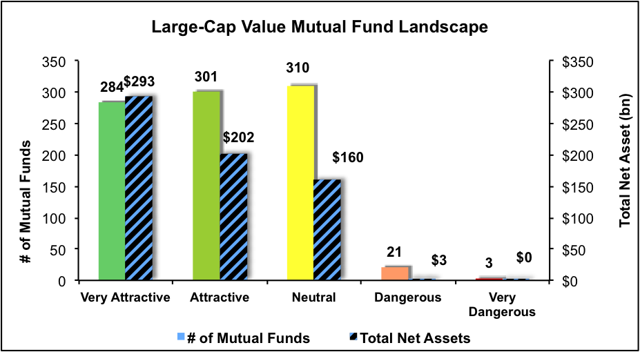 Summary Large Cap Value style ranks first in Q2’15. Based on an aggregation of ratings of 42 ETFs and 920 mutual funds. SCHD is our top rated Large Cap Value ETF and CDOYX is our top rated Large Cap Value mutual fund. The Large Cap Value style ranks first out of the 12 fund styles as detailed in our Q2’15 Style Ratings report. It gets our Attractive rating, which is based on aggregation of ratings of 42 ETFs and 920 mutual funds in the Large Cap Value style. Figures 1 and 2 show the five best and worst rated ETFs and mutual funds in the style. Not all Large Cap Value style ETFs and mutual funds are created the same. The number of holdings varies widely (from 15 to 1003). This variation creates drastically different investment implications and, therefore, ratings. Investors seeking exposure to the Large Cap Value style should buy one of the Attractive-or-better rated ETFs or mutual funds from Figures 1 and 2. Figure 1: ETFs with the Best & Worst Ratings – Top 5 (click to enlarge) * Best ETFs exclude ETFs with TNAs less than $100 million for inadequate liquidity. The iShares Enhanced U.S. Large Cap ETF (NYSEARCA: IELG ) and The First Trust NASDAQ Rising Dividend Achievement ETF (NASDAQ: RDVY ) are excluded from Figure 1 because their total net assets are less than $100 million and do not meet our liquidity minimums. Figure 2: Mutual Funds with the Best & Worst Ratings – Top 5 (click to enlarge) * Best mutual funds exclude funds with TNAs less than $100 million for inadequate liquidity. The Schwab U.S. Dividend Equity ETF (NYSEARCA: SCHD ) is our top-rated Large Cap Value ETF and the Columbia Funds Dividend Opportunity Fund (MUTF: CDOYX ) is our top-rated Large Cap Value Mutual Fund. Both earn our Very Attractive rating. One of our favorite stocks held by Large Cap Value funds is Travelers Companies (NYSE: TRV ). Since 2008, Travelers has grown after tax profit ( NOPAT ) by 5% compounded annually. More recently, the company has ramped up its NOPAT growth, growing profits by 51% compounded annually since 2011. The company currently has a 12% return on invested capital ( ROIC ), over $3.4 billion in free cash flow on a trailing 12-month basis, and positive economic earnings for eight of the past 10 years. However, at its current price of ~$101/share, Travelers is significantly undervalued, with a price to economic book value ( PEBV ) ratio of 0.6. This ratio implies the market expects Travelers’ profits to permanently decline by 40% from current levels, despite the fact that the most recent results show Travelers doing the exact opposite, growing profits by over 50%. If Travelers can grow NOPAT by just 5% compounded annually for the next seven years , the stock is worth $200/share today – a 98% upside. The Columbia American Beacon Large Cap Value ETF (NYSEARCA: GVT ) is our worst rated Large Cap Value ETF and the Good Harbor Tactical Equity Income Fund (MUTF: GHTAX ) is our worst rated Large Cap Value mutual fund. GVT earns our Neutral rating and GHTAX earns our Very Dangerous rating. One of the worst stocks held by Large Cap Value funds is Williams Companies (NYSE: WMB ). Since 2011, the company has been troubled by its inability to create shareholder value. During the past six years, ROIC at the company has never exceeded 7%. Over this same time period, Williams’ ROIC was less than the cost of deploying the capital in its core business operations, resulting in the company producing negative economic earnings since 2009. NOPAT over the last four years has been equally disappointing. In 2011 Williams’ NOPAT was $1.7 billion. Every year since, NOPAT has declined by a compounded annual rate of 13% to just $1.4 billion in 2014. WMB’s stock price does not reflect the deteriorating and value-destroying nature of its fundamental business operations. Since 2011, WMB’s stock price has increased by 33%. But to justify its current price of $48/share the company would need to grow NOPAT by 16% for the next 14 years . This seems very optimistic given that the company’s historical NOPAT growth over the past decade has been only 3%. Figures 3 and 4 show the rating landscape of all Large Cap Value ETFs and mutual funds. Figure 3: Separating the Best ETFs From the Worst ETFs (click to enlarge) Figure 4: Separating the Best Mutual Funds From the Worst Funds (click to enlarge) Sources Figures 1-4: New Constructs, LLC and company filings D isclosure: David Trainer owns TRV. David Trainer and Allen L. Jackson receive no compensation to write about any specific stock, style, style or theme. Disclosure: I am/we are long TRV. (More…) I wrote this article myself, and it expresses my own opinions. I am not receiving compensation for it. I have no business relationship with any company whose stock is mentioned in this article. Scalper1 News
Scalper1 News