Scalper1 News

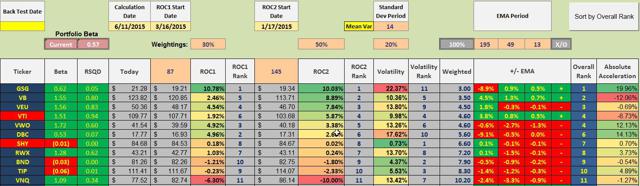
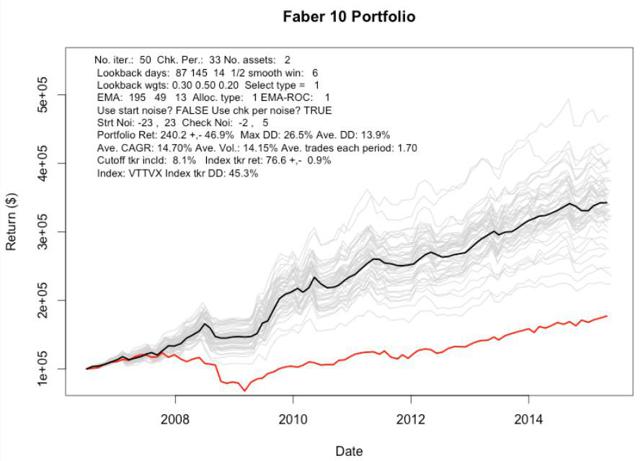 Long only, ETF investing, portfolio strategy, momentum “}); $$(‘#article_top_info .info_content div’)[0].insert(bottom: $(‘mover’)); } $(‘article_top_info’).addClassName(test_version); } SeekingAlpha.Initializer.onDOMLoad(function() setEvents();); How to enhancing a Buy and Hold strategy with Dual Momentum Model. Reduce volatility and portfolio draw-down with an ETF cutoff model. How to apply both absolute and relative momentum to portfolio management. How to triple portfolio returns over a stock-bond index fund. Beginning with the ten (10) ETFs identified in Mebane T. Faber and Eric W. Richardson’s book, The Ivy Portfolio , the following analysis shows how the IVY portfolio would have performed from June 30, 2006 through 6/11/2015 when a momentum model is applied to these ETFs. The ETFs using in this analysis are the IVY 10 plus SHY , our cutoff or “circuit breaker” ETF. Here is the portfolio strategy used with the IVY 10. Rank the ETFs as shown in the following table. Review period is every 33 days. This moves the review or update throughout the month, thus avoiding short-term trading fees, wash rule, and end of month mutual fund window dressing. Look-back periods are 87 days with a 30% weight, 145 days with a 50% weight, and 20% assigned to a 14-day mean-variance volatility setting. ETFs performing below SHY using this ranking system are sold out of the portfolio. Select the top two performing ETFs and invest equal percentages in each. If there is a tie, invest in equal amounts in the three or four top performing ETFs. The absolute momentum model identifies ETFs that are ranked above SHY. The ranking model identifies the relative momentum between the various ETFs. IVY 10 ETF Rankings: The following table (generated from spreadsheet) shows both the absolute and relative momentum for the 10 IVY ETFs. The following table includes 6/11/2015 data. GSG and VB are the top two performing ETFs based on the three metrics used to come up with these rankings. If one were to follow this model today, we would invest equal dollars in GSG and VB. (click to enlarge) IVY 10 Back-Test Results: How has this investing model worked since June 2006? The following graph shows a Monte Carlo calculation where the dark black line is the average performance of the IVY 10. The red line is the performance of our stock-bond benchmark, VTTVX . Note the light gray lines as they show other probabilities or noise around the review days. In reality, investors are likely to make trades from 2 days before the review period to as many as 5 days after the review period. Call this trading noise. Even the worst light gray line outperforms the VTTVX benchmark. Here are a few salient points when Dual Momentum is applied to the IVY or Faber 10. Portfolio return = 240% vs. 77% for the VTTVX index fund. Maximum draw-down (DD) for portfolio is 27% vs. 45% for VTTVX. Average annual DD for portfolio is 14% or under 15%, what might be considered an acceptable level. Average Compound Annual Growth Rate (CAGR) = 14.7%. Trades per review period = 1.7. Tax considerations may dictate one use this model only with tax-deferred accounts. (click to enlarge) Disclaimer: After running hundreds of back-tests using similar models to what is described above, there is still a considerable amount of luck when it comes to the day in which a particular ETF is purchased. The “trading noise” analysis helps to temper this problem, but it is still there. Also, the above model does not account for remaining cash that is left lying around due to dividends and money not invested due to share rounding. Taxes are also an issue as mentioned above. Investors in the 28% tax bracket need to add something close to 2% annually to overcome the difference between short and long-term capital gain taxes. Each investor should take their own tax situation into consideration. Disclosure: The author is long VTI,VEA. (More…) The author wrote this article themselves, and it expresses their own opinions. The author is not receiving compensation for it (other than from Seeking Alpha). The author has no business relationship with any company whose stock is mentioned in this article. Additional disclosure: Back-testing analysis was run by interested investor. Share this article with a colleague Scalper1 News
Scalper1 News