Scalper1 News
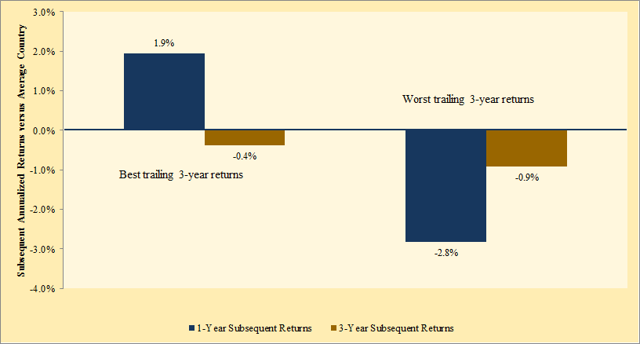
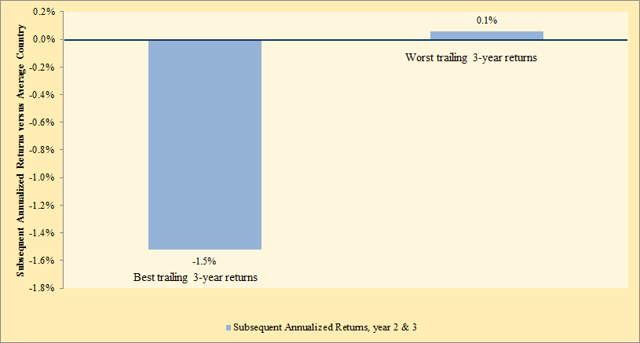 By Baijnath Ramraika, CFA Ben Inker, in GMO’s 4Q 2014 quarterly letter , suggests that there is significant valuation disparity among developed markets with U.S. markets getting a much higher valuation in relation to others. He suggests that given this disparity, it makes more sense to invest in the bad and ugly countries as against the good-looking U.S. In that same letter, Ben shows that it is better to be a contrarian. As evidence, he shows that those developed markets which had the strongest relative performance over the past three years, tend to underperform over the next one- and three-year periods. On the other hand, the worst performing developed markets over the past three years, tend to outperform over the next one- and three-year periods. Wanting to verify, I setup a similar process based on the all-stock developed market indexes that I discussed in one of my earlier articles . The objective was to check the relative investment performance of investing in strongest versus weakest performing developed markets over the past three years. To achieve this, I used country indexes calculated in dollar terms. At the end of every year, I calculated the annualized trailing 3-year return for every country. This return was compared to the average return of all developed market countries to derive relative out(under)performance. Each country was then ranked based on its trailing 3-year relative performance with five best and worst performing countries chosen for further analysis. Figure 1 shows the average 1-year and 3-year subsequent annualized excess returns for the best and worst five countries. It is important to note that the time frame of this study is 1995 to 2014. With three years of past performance as the selection criteria, the study begins at end of the year 1997. Figure 1 (click to enlarge) Trailing 3-year performance as a predictor for forward returns Clearly, my numbers are not in sync with what Ben Inker found in his analysis. There are several possible reasons for this difference. For one, the time period of my study may be different than the time period used by Ben. Secondly, while my study utilizes all stock indices, it is possible that indices used by Ben are somewhat narrower in representation. Keeping the different result aside, what Figure 1 suggests is that there is some momentum persistence, at least in the near term. The best performing five countries continued to outperform over the next year while the worst performing five countries continued to underperform over the next year. However, as is evident by the difference between 1-year and 3-year subsequent annualized returns, there seems to be some mean reversion taking place in year 2 and 3. Figure 2 shows this mean reversion. Figure 2 (click to enlarge) Mean reversion takes hold in the second and third year As is seen, countries with the best 3-year trailing performance experience negative relative performance in the second and the third year, i.e., momentum persists over the one-year period with mean reversion taking over after that. In summary, both momentum and mean reversion have an effect on subsequent investment returns. However, their effects are felt in different time frames. Scalper1 News
Scalper1 News