Scalper1 News
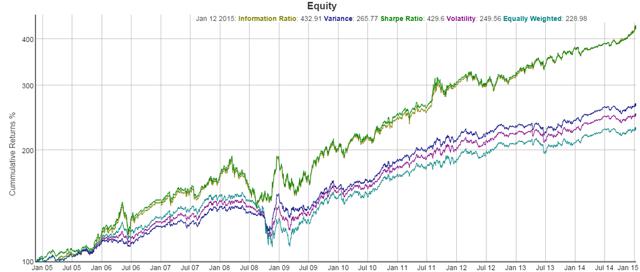
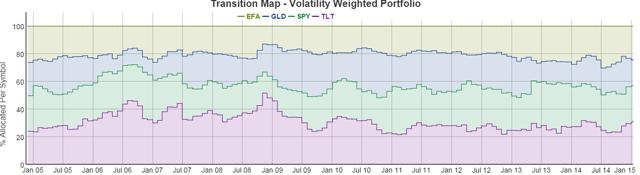
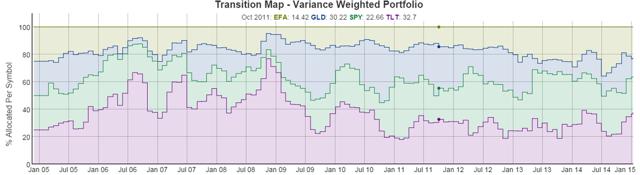
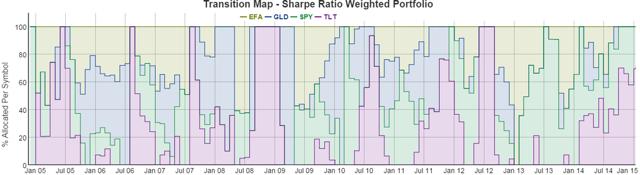
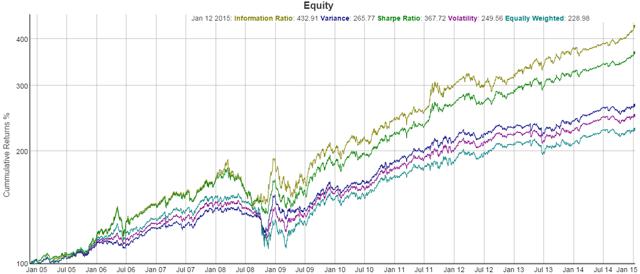
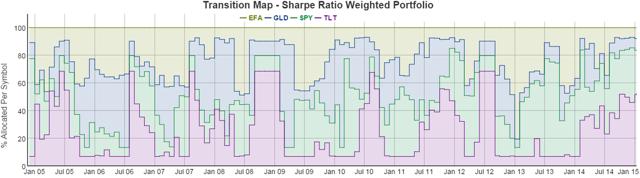 Summary Adaptive asset allocation enables an investor to capture higher returns and reduce risk compared to “buy and hold” and “fixed asset allocation”. Adaptive asset allocation can adjust the portfolio to compensate for varying market conditions. A backtest from Nov 2005 to Jan 2015 shows one allocation strategy resulting in more than double the returns and much less risk compared to a buy and hold strategy. Adaptive asset allocation is often cited as an attractive alternative to fixed or standard asset allocation so popularly used. Standard asset allocation or fixed asset allocation is the idea of allocating 10% of your portfolio to this and 25% to that and another 7% to this asset class and keeping that percentage fixed regardless of market circumstances. Adaptive asset allocation is quite different in how it decides how much is allocated to each asset in a portfolio, instead of using fixed numbers set by an individual or corporation at one time during one market cycle and sticking with it through thick and thin, adaptive asset allocation adjusts or adapts the portfolio weightings on a regular basis based on maximizing or minimizing a certain performance metric such as volatility or variance or even the Sharpe ratio. Market cycles as well as bear markets can be ruinous at worst and challenging at best for most fixed asset allocation models. If you recall 2008, the S&P 500 lost around 55% of it’s value, but Gold didn’t miss a beat until it has lost 1/3 of it’s value from 2011-2013. Bonds surged while the stock market crashed in 2008, but many bonds faltered for much of 2013 while the stock market soared. Certainly you can see why diversifying a portfolio is of great value, but it begs the question “Why did we have to hold on to the stock funds we were invested in?”. The first reason we could cite is a very valid one, and it is because we needed to hold onto it so we could benefit from it in the good years like 2013. The next question you may ask is “Why couldn’t we reduce the amount of money we have in the stock market when it is falling or the bond market when it was falling and why have I been holding so much Gold the last few years?”. This is where a fixed allocation system simply says we set a fixed amount and we stick to it regardless of circumstances, but lets take a look at how adaptive asset allocation answers this question. Enter Adaptive Asset Allocation Adaptive Asset Allocation sets the weight of each asset in your portfolio not by a fixed percentage but as a result of optimizing different performance metrics. For example, we could optimize a portfolio’s weightings to minimize volatility or minimize variance or maximize the risk adjusted return (Sharpe Ratio). Each of these optimization criterion can be used to decide how much of each asset in your portfolio instead of using a fixed percentage. As you can see, adaptive asset allocation answers the questions posed above, namely how can we reduce the allocation in a certain asset when it is doing poorly. We are now going to reduce our assets in an asset that is volatile or has a high variance or a low risk adjust return (Sharpe Ratio), and increase our assets in funds that have low volatility or low variance or a high risk adjusted return. Our Test Now that we have established the rationale for why we might want to use adaptive asset allocation let’s test a sample portfolio to see if Adaptive Asset Allocation can improve returns and reduce drawdown. For this portfolio I am going to use Exchange Trade Funds (ETFs) to select US Stocks, International Stocks, Gold, and US Treasury bonds as our portfolio assets. The tickers used are SPY for US Stocks, EFA for International Stocks, GLD for Gold, and TLT for US Treasury bonds. Parameters We are going to try 3 different performance metrics for deciding our weighting, the first is minimizing volatility, the second is minimizing variance, and the third is maximizing the risk adjusted return (Sharpe Ratio). For all calculations we are just going to use the 3 month trailing volatility, variance, and Sharpe ratio as our measurement. We are going to adjust the portfolio on a monthly basis, this may be too often or not often enough, but for an introduction to these type of ideas it is what we will use. Results – Volatility (click to enlarge) Pink Line is Volatility Returns (click to enlarge) Weightings for each symbol over time (EFA=yellow, GLD=blue, SPY=green, TLT=pink) The performance for the minimum volatility weighted portfolio is: 9.42% CAGR 0.98 Sharpe Ratio 9.72% Volatility 22% maximum draw down This compares to the equally weighted version of this portfolio (25% SPY, 25% GLD, 25% EFA, 25% TLT): 8.5% CAGR 0.76 Sharpe Ratio 11.61% Volatility 28.81% maximum draw down And to the S&P 500 alone: 7.64% CAGR 0.47 Sharpe Ratio 19.96% Volatility 55.22% maximum draw down The minimum volatility adaptive asset allocation portfolio successful outperformed the S&P 500, and equally weighted portfolio in all the performance metrics shown above! As you will see in the transition map image above, the volatility adaptive asset allocation did a lot of what we mentioned to reduce risk; during the 2008 stock market crash the % in SPY and EFA dropped considerably, while the bond fund took over a large percentage of the portfolio, and recently the allocation in gold has been dropping to reduce the exposure to the falling gold market. Results – Variance (click to enlarge) Blue Line is Variance Returns (click to enlarge) Weightings for each symbol over time (EFA=yellow, GLD=blue, SPY=green, TLT=pink) The performance for the minimum variance weighted portfolio is: 10.1% CAGR 1.12 Sharpe Ratio 8.95% Volatility 14.84% maximum draw down The minimum variance adaptive asset allocation portfolio again successful outperformed the S&P 500, and equally weighted portfolio in all the performance metrics shown above! The minimum variance adaptive asset allocation did even more than the minimum volatility portfolio to reduce risk and increase returns. During the 2008 stock market crash the % in SPY and EFA dropped to near 0%, while the bond fund took over the majority of the portfolio, the allocation in bonds dropped while stocks recovered, and recently the allocation in gold has been dropping to near 0% to reduce the exposure to the falling gold market. Results – Risk Adjusted Return (Sharpe Ratio) (click to enlarge) Green Line is Sharpe Ratio Returns (click to enlarge) Weightings for each symbol over time (EFA=yellow, GLD=blue, SPY=green, TLT=pink) The performance for the maximum Risk Adjusted Return (Sharpe Ratio) weighted portfolio is: 15.43% CAGR 1.07 Sharpe Ratio 14.4% Volatility 27.27% maximum draw down The maximum Sharpe ratio adaptive asset allocation portfolio again successful outperformed the S&P 500, and equally weighted portfolio in all the performance metrics shown above – especially returns! The maximum Sharpe Ratio adaptive asset allocation did a lot to increase returns and even managed to outperform in the areas of drawdown and volatility over the S&P 500 and equal weight portfolios. Optimizing the Sharpe ratio is definitely aggressive, you will notice how it often completely eliminates assets from the portfolio and even is only in a single asset during certain times. During the 2008 stock market crash the % in SPY and EFA dropped to 0%, while the bond fund took the entire 100% of the portfolio, the allocation in bonds dropped while stocks recovered and there were many times when stocks where 100% of the portfolio, and recently gold has been almost completely absent from the portfolio even though it played a strong role in the portfolio when it was surging upwards earlier in the backtest. One More Thing… One thing that may be problematic is the fact that some of these allocations involve entirely or nearly getting rid of an investment, especially the Sharpe Ratio portfolio. One thing we can do to combat this is what I call “dampen” the weighting algorithms. This involves “dampening” the effects of each weighting algorithm by only allowing the weighting algorithm to go so far. For example you could decide you want to hold no less than 5% of a certain asset, you could then call 0-4% 5% and adjust the other weightings accordingly to effectively “dampen” the effect of the weighting algorithm to make the portfolio more like a fixed allocation strategy. So lets take a quick look at “dampening” the Sharpe Ratio adaptive asset allocation portfolio to see what a little more conservative switching can do: Results – Risk Adjusted Return (Sharpe Ratio) with ~7% Minimum per Asset (click to enlarge) Green Line is Sharpe Ratio with Dampening Applied (click to enlarge) Weightings for each symbol over time (EFA=yellow, GLD=blue, SPY=green, TLT=pink) The performance for the maximum Risk Adjusted Return (Sharpe Ratio) weighted portfolio with dampening is: 13.68% CAGR 1.13 Sharpe Ratio 12.04% Volatility 24.68% maximum draw down So we reduced the full effect of the Sharpe Ratio weighting and we got a portfolio that did not entirely eliminate any symbol, but also wasn’t afraid to aggressively reduce its allocation in assets when they had a bad risk adjusted return value. The results show a smaller CAGR return %, but improvements in the area of Sharpe Ratio, volatility, and maximum drawdown. Conclusion Adaptive asset allocation can be used to re-weight our portfolio to reduce drawdown and increase returns in the ever changing markets as opposed to a more traditional fixed asset allocation. We tested 3 techniques that can be used to weighted a portfolio and noticed how each responded to the changes in the stock markets, bond markets, and gold market. Each strategy was able to outperform a standard buy and hold approach and the stock market, while also delivering better volatility and draw down numbers in the backtests presented above. With ever increasing uncertainty in the direction of the markets and how best to diversify a portfolio adaptive asset allocation may be one answer of how to eliminate guesswork and provide a foundation for adjusting allocations to compensate for the winds and waves of the markets. Scalper1 News
Scalper1 News