Scalper1 News
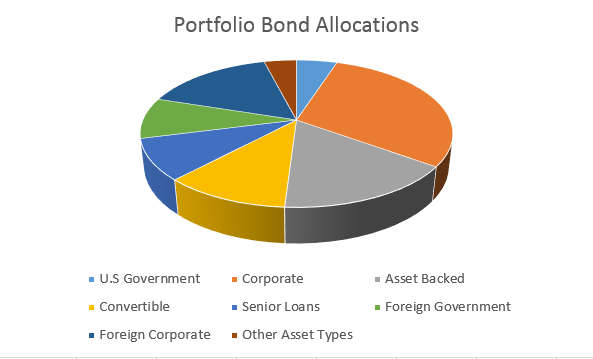
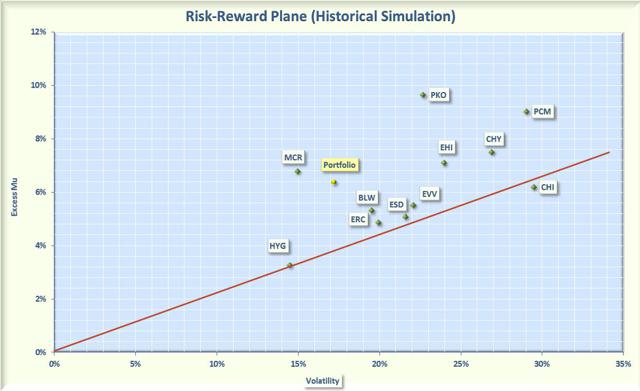
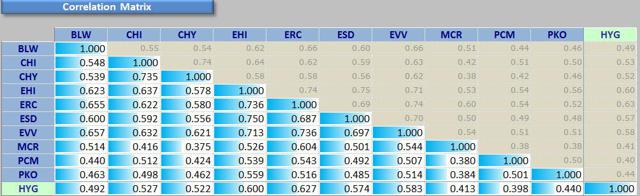
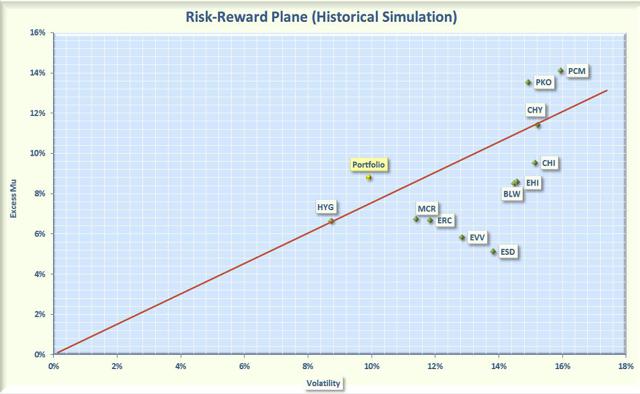
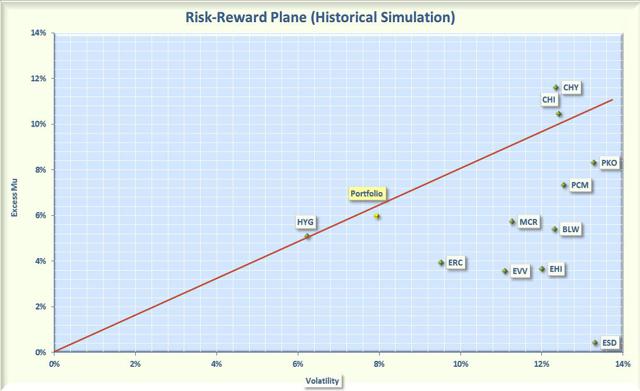 Summary A portfolio of selected bond CEFs provides an average distribution of 8.6%. Since 2007, the composite portfolio of selected bond CEFs outperformed HYG, the popular high-yielding bond ETF. Bond CEFs offer excellent diversification when included in a traditional high-yield bond portfolio. I recently wrote an article on a diversified closed-end fund (CEF) portfolio that included a range of equity funds but had only 28% of the assets allocated to bonds. I realized that many retirees would like to have a higher percentage in bonds, so I wrote this article, which focuses exclusively on bond CEFs. I chose only funds that were in existence during the 2008 bear market so that I could judge performance during a recessionary period. Other criteria included: An average daily volume of at least 100,000 shares per day to facilitate liquidity A distribution of at least 6% without excessive amounts of Return of Capital (ROC) A market cap of at least $150 million, but the larger the better A premium of no more than 5% Using these criteria, I then selected funds that would provide a diversified mix of: government and corporate bonds from both the U.S. and internationally, asset-backed bonds, convertible bonds, and senior loans. The 10 CEFs that I chose are summarized below. There is a large universe of bond CEFs, so I welcome alternative suggestions from readers. BlackRock Duration Income Trust (NYSE: BLW ): This CEF sells for a discount of 8.2%, which is a substantially larger discount than the 3-year average discount of 1.7%. The fund concentrates on intermediate-duration debt securities and senior loans. It has a portfolio of 873 securities, with 41% invested in corporate bonds, 32% in loans, and 12% in asset-backed bonds. About 25% of the portfolio is investment-grade. In 2008, the price of this fund dropped about 25%. The fund utilizes 30% leverage and has an expense ratio of 1.1%. The distribution is 7.6%, funded by income with no ROC. Calamos Convertible Opportunities & Income Fund (NASDAQ: CHI ): This CEF sells for a small premium of 1.1%, which is in contrast to 0.1% average discount over the past 3 years. The fund has a portfolio of 278 securities, with 53% in convertible bonds and 41% in corporate bonds. Only about 17% of the portfolio is rated investment-grade. In 2008, the price of this fund dropped 35%. The fund utilizes 28% leverage, and has an expense ratio of 1.5%. The distribution is 8.9%, funded mostly by income but with some ROC. Calamos Convertible & High Income Fund (NASDAQ: CHY ): This CEF sells at a premium of 3.4%, in contrast to a 3-year average discount of 3.7%. The fund has a portfolio of 277 securities, with 59% in convertibles and 36% in corporate bonds. Only about 15% of the bonds are investment-grade. This fund dropped 27% in price during 2008. It utilizes 28% leverage, and has an expense ratio of 1.5%. The distribution is 8.6%, funded primarily from income, but with some ROC. This fund is about 74% correlated with its sister fund CHI. Western Asset Global High Income Fund (NYSE: EHI ): This CEF sells for a discount of 8.8%, which is a greater discount than the 3-year average discount of 4%. The fund has a portfolio of 558 securities, with 77% in high-yield bonds and 16% in government bonds. This fund lost 30% in 2008. It utilizes 22% leverage, and has an expense ratio of 1.5%. The distribution is a high 10.6%, funded by income with no ROC. Wells Fargo Advantage Multi-Sector Income Fund (NYSEMKT: ERC ): This CEF sells at a discount of 11.5%, which is a larger discount than the 3-year average discount of 8.8%. The fund has a portfolio of 679 securities, spread among corporate bonds (54%), government bonds (19%), senior loans (12%), and asset-backed bonds (6%). About 36% of the holdings are investment-grade. The fund only lost 20% in 2008. It utilized 25% leverage, and has an expense ratio of 1.2%. The distribution is 8.5%, funded by income with no ROC. Eaton Vance Limited Duration Income Fund (NYSEMKT: EVV ): This CEF sells at a discount of 10.8%, which is a larger discount than the 3-year average discount of 4.4%. The fund has a large portfolio of 1692 securities spread across loans (38%), corporate bonds (35%), and asset-backed bonds (24%). About 32% of the holdings are investment-grade. The price of this fund dropped 27% in 2008. The fund utilizes a relatively high 40% leverage, and has an expense ratio of 1.7%. The distribution is 8.7%, funded primarily by income, with a very small ROC component. Western Asset Emerging Markets Debt Fund (NYSE: ESD ): This CEF sells at a discount of 11.1%, which is a larger discount than the 3-year average discount of 7.2%. The fund has a portfolio of 222 securities, with 54% in government bonds, and 46% in corporate bonds. About 64% of the bonds in the portfolio are rated investment-grade. This fund only lost about 20% in 2008. The fund only uses 10% leverage, and has an expense ratio of 1%. The distribution is 8.7%, funded by income with no ROC. MFS Charter Income Trust (NYSE: MCR ): This CEF sells at a discount of 11.7%, which is a larger discount than the 3-year average discount of 7.8%. The fund has a portfolio of 857 securities, with about 45% in corporate bonds, 12% in government debt, and 35% in foreign securities. About 34% of the portfolio is investment-grade. The fund utilizes 15% leverage, and has an expense ratio of 0.9%. The distribution is 6.2%, funded by income with no ROC. PCM Fund (NYSE: PCM ) : This CEF sells at a discount of 1.3%, which is well below the 3-year average premium of 5.8%. The fund focuses on commercial mortgage backed securities and non-investment grade securities. The portfolio is spread over 247 holdings, with 82% in asset-backed bonds and 18% in corporate bonds. About 35% of the holdings are investment-grade. The price of the fund dropped about 30% in 2008. The fund utilizes 32% leverage, and has an expense ratio of 2%. The distribution is 9%, with only a small ROC component. PIMCO Income Opportunity Fund (NYSE: PKO ): This CEF currently sells at a discount of 2.2%, which is in contrast to the 3-year average premium of 2.5%. The portfolio has 470 holdings allocated primarily among asset-backed bonds (42%) and corporate bonds (40%). Only about 30% of the holdings are investment-grade. The price of the fund dropped 24% in 2008. The fund utilizes 38% leverage, and has an expense ratio of 1.9%. The distribution is 8.3%, with only a small return of capital component. For comparison with other popular high-yield bond funds, I also added the following Exchange Traded Fund (ETF) to my analysis. iShares iBoxx $ High Yield Corporate Bond ETF (NYSEARCA: HYG ): This ETF tracks an index of about a thousand high-yield U.S. corporate bonds across all sectors of the economy. The fund does not use leverage, and has an expense ratio of 0.5%. It yields 5.7% without any ROC. During 2008, the price of this ETF dropped by 17%, but the NAV dropped by 23%. It is unusual for an ETF to have a large difference between price and NAV, but this just illustrates the dislocations that occurred during the 2008 bear market. Composite Portfolio If you equal-weight each of the selected CEFs, the resulting composite portfolio has the allocations shown graphically in Figure 1. As you can see, the composite portfolio is well diversified. Numerically, the allocations are: 5% U.S. government, 30% corporate, 16% asset-backed, 11% convertibles, 9% senior loans, 9% foreign government, 16% foreign corporate, and 4% other (cash, preferred issues, etc.). Personally, I would have liked a larger allocation to U.S. government bonds, but it was difficult to find Treasury-focused funds that had distributions exceeding 6%. Overall, this portfolio had 31% investment-grade securities. Figure 1: Composition of bond portfolio The composite portfolio has an average distribution of 8.6%, which certainly meets my criteria for high income. But total return and risk are as important to me as income, so I plotted the annualized rate of return in excess of the risk-free rate (called Excess Mu in the charts) versus the volatility for each of the component funds. I used a look-back period from October 12, 2007 (the market high before the bear market collapse) to 21 January, 2015. The Smartfolio 3 program was used to generate the plot shown in Figure 2. (click to enlarge) Figure 2: Risks versus rewards over the bear-bull cycle The plot illustrates that the CEFs have booked a wide range of returns and volatilities since 2007. To better assess the relative performance of these funds, I calculated the Sharpe Ratio. The Sharpe Ratio is a metric developed by Nobel laureate William Sharpe that measures risk-adjusted performance. It is calculated as the ratio of the excess return over the volatility. This reward-to-risk ratio (assuming that risk is measured by volatility) is a good way to compare peers to assess if higher returns are due to superior investment performance or from taking additional risk. In Figure 2, I plotted a red line that represents the Sharpe Ratio associated with HYG. If an asset is above the line, it has a higher Sharpe Ratio than HYG. Conversely, if an asset is below the line, the reward-to-risk is worse than HYG. Over the bear-bull cycle, all the individual bond CEFs were more volatile than HYG. However, when combined into an equally weighted composite portfolio, the volatility was only slightly more than HYG. This is an illustration of an amazing discovery made by an economist named Markowitz in 1950. He found that if you combined certain types of risky assets, you could construct a portfolio that had less risk than the components. His work was so revolutionary that he was awarded the Nobel Prize. The key to constructing such a portfolio was to select components that were not highly correlated with one another. In other words, the more diversified the portfolio, the more potential volatility reduction you can receive. Some other interesting observations are evident from the figure. All the bonds CEFs had a higher volatility than HYG, but in each case, this was coupled with a higher return. All the CEFs except for CHI were above the “red line,” which means that the investor was adequately compensated for increased risks. The best-performing bond CEF on a risk-adjusted basis was MCR, but PKO was not far behind. The worst-performing bond CEF was CHI, which had a higher return than HYG, but a much larger volatility. This caused the risk-adjusted return associated with CHI to lag slightly behind HYG. The least volatile bond CEF was MCR, and the most volatile was CHI. The composite portfolio handily outperformed HYG on a risk-adjusted basis. I next wanted to assess the diversification of this portfolio. To be “diversified,” you want to choose assets such that when some of them are down, others are up. In mathematical terms, you want to select assets that are uncorrelated (or at least not highly correlated) with each other. I calculated the pair-wise correlations associated with the funds. The data is presented in Figure 3. All the CEFs had relatively low correlations with HYG (in the 40%-60% range). This bodes well for including these CEFs in a more traditional high-yield bond portfolio. Among the CEFs, the correlations were also low, with only a few above 70%. Overall, these results were consistent with a well-diversified portfolio. (click to enlarge) Figure 3: Correlations over the bear-bull cycle My next step was to assess this portfolio over a shorter time frame when the stock market was in a strong bull market. I chose a look-back period of 5 years, from January 2010 to January 2015. The data is shown in Figure 4. During this period, the bond CEFs did not fare as well, with many of the CEF booking a risk-adjusted performance less than HYG. Only 3 of the CEFs (CHY, PKO, and PCM) outperformed HGY. However, I was happy to see that the combined portfolio continued to outperform HYG during this bull market period. (click to enlarge) Figure 4: Risks versus rewards over the past 5 years Based on the above, I wanted to see if the outperformance continued during the more recent past. I next used a look-back period of 3 years, and the results are shown in Figure 5. As you might have expected, HYG had an impressive run during this strong bull period. Only the convertible CEFs (CHI and CHY) were able to keep pace on a risk-adjusted basis. However, as with the 5-year period, the combined portfolio performed well, lagging HYG by only a small amount on a risk-adjusted basis. The major detriment to the portfolio performance was ESD, which has had a horrible 3 years, just barely managing to remain in the black. This was because of a general sell-off in emerging market assets that has only recently abated. Many investors might be tempted to drop ESD from the portfolio, but I am inclined to give it the benefit of the doubt with the expectation that emerging markets may recover in the future. Overall, I continue to be pleased with the portfolio performance. (click to enlarge) Figure 5: Risks versus rewards over the past 3 years Bottom Line The bond CEFs in this portfolio were all volatile, and taken individually, they would not be suitable for a risk-averse investor. As discussed, most of these funds also had substantial losses during 2008. However, if you risk profile allows you to purchase high-yield bonds, the composite portfolio delivered some excellent risk-adjusted performances over the periods analyzed. No one know how this portfolio will perform in the future, but based on past history, I believe it is worthy of consideration for an income investor who is also seeking total return at a reasonable risk. Scalper1 News
Scalper1 News