Scalper1 News
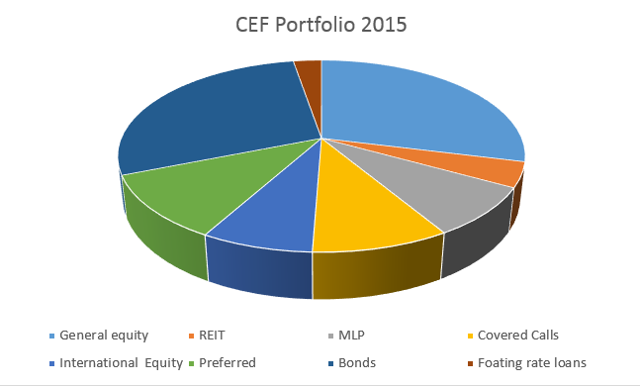
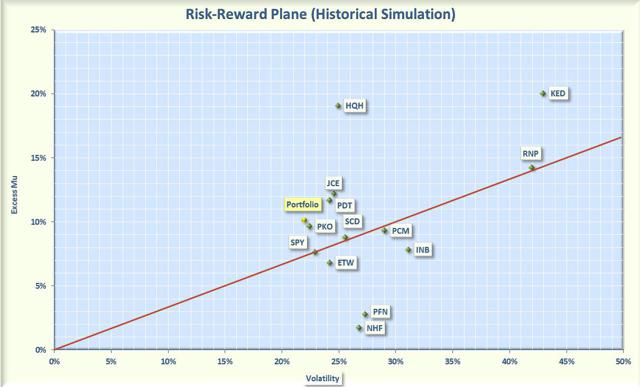
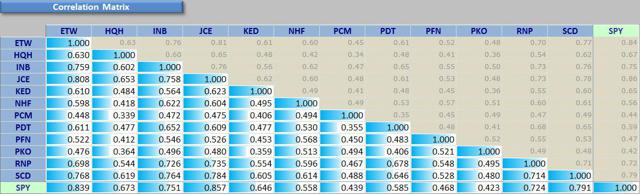
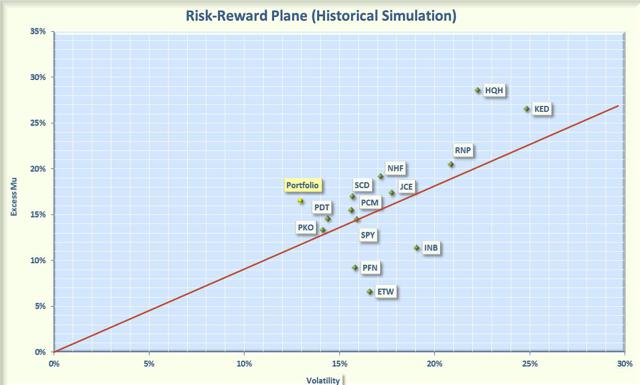
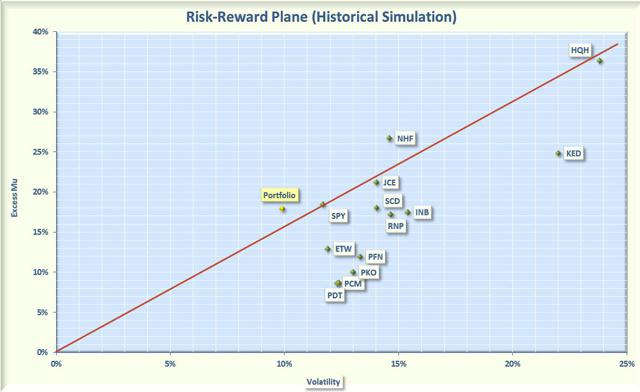
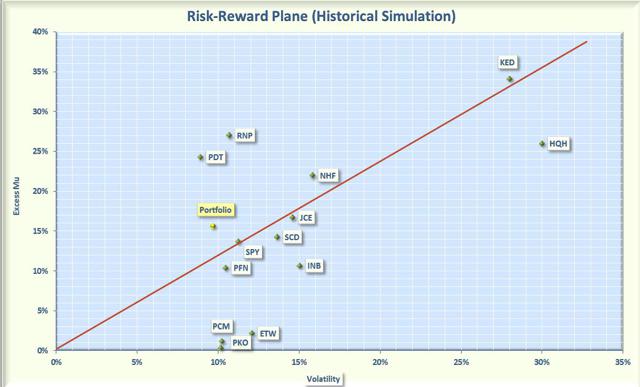 Summary For the bear-bull cycle beginning in 2007, the CEF Portfolio generated a higher return than the S&P 500 with substantially less risk. For all time frames analyzed since 2007, the CEF Portfolio outperformed the S&P 500 on a risk-adjusted basis. The CEF Portfolio has a high average distribution of 7.9%. January is a traditional time to reassess the markets and position your portfolio for the New Year. As an income focused investor, I’m a fan of Closed End Funds (CEFs) and have written many articles on Seeking Alpha discussing their risks and rewards. For this article, I reviewed my previous analyses and selected some of the best performing CEFs to construct a diversified portfolio that had returns similar to the S&P 500 but with less risk (as measured by volatility). I don’t know how long the bull will continue to romp but I’m beginning to worry that the bull market is getting “long in the tooth” (it is now the 3rd longest since the Great Depression). I therefore decided to construct a more defensive portfolio with a diversified mix of equity, specialty, and fixed income funds. I chose only funds that were in existence during the 2008 bear market so that I could judge performance over a complete bear-bull cycle. The 12 CEFs that I chose are summarized below together with my rationale for selecting. There is a large universe of CEFs so I welcome alternative suggestions from readers. Equity Focused CEFs The first third of the portfolio is composed of equity focused CEFs. These funds consist mostly of equities but have some additional traits (such as the use of options) that might help increase returns or minimize risks. Nuveen Core Equity Alpha (NYSE: JCE ) . This CEF sells at a discount of 2.4%, which is less than the 3 year average discount of 5.9%. It has 362 holdings selected from the S&P 500 by using a proprietary mathematical algorithm. The formula attempts to add “alpha” by generating returns better than the S&P 500. It does not employ leverage and has a 1% expense ratio. It has a distribution of 7%, consisting primarily of income and long term gains, with no return of capital (NYSE: ROC ) over the past year. Limit orders should be used when buying and selling this CEF because the volume is not high (just barely trading 50,000 shares per day). Rationale for selecting. The algorithm for adding alpha appears to be working. LMP Capital & Income (NYSE: SCD ) . This CEF sells at a 10% discount, which is less than the 3 year average discount of 7.7%. It has 102 holdings, spread primarily among general equity (75%) and convertible (16%). It employs 23% leverage and has a 1.4% expense ratio. The distribution rate is 6.6%, which is paid from mostly from income but with a small (less than 15%) non-destructive ROC component. Rationale for selecting: I liked the well diversified equity selections plus the use of convertible bonds. Eaton Vance Tax-Managed Global Buy-Write Opportunities (NYSE: ETW ) . This covered call CEF sells at a discount of 6.8%, which is less than the 3 year average discount of 9.5%. . This is a large fund with 460 holdings, with 55% from U.S. firms. After the United States, the largest holdings are from Europe. The fund utilizes index options that cover about 93% of the value of the portfolio. The fund does not use leverage and the expense ratio is 1.1%. The distribution is 10.1% consisting of primarily nondestructive ROC (which is usual for covered call funds). Rationale for selecting. I liked the international flavor of the fund and the use of index options to increase income. Cohen & Steers Global Income Builder (NYSE: INB ) . This covered call CEF sells at a discount 0f 0.4%, which is less than the 3 year average discount of 5.5%. The fund employs five proprietary strategies to select stocks from 5 global domains: large-cap, infrastructure, preferred securities, real estate securities, and other closed end funds. The portfolio has 235 holdings, with 90% in equity and 10% in other income focused securities such as preferred stock. The fund also uses options to enhance income. About 55% of the holdings are domiciled in the United States with the rest invested primarily in European stocks. This is one of the few covered call CEFs that use leverage (currently about 19%). INB has an expense ratio of 1.8% and the distribution is 9.5%, paid primarily from nondestructive ROC . Rationale for selecting . I liked option income coupled with stock selection strategies that included a significant amount of international stocks. Specialty Focused CEFs Specialty focused funds were selected for diversification and for added pizzazz (some of these funds had large returns coupled with large volatility). Cohen and Steers REIT and Preferred Income Fund (NYSE: RNP ) . This CEF sells for a discount of 12.4%, which is lower than its 3-year average discount of 9.3%. The portfolio contains 203 holding with 50% in REITs and 48% in preferred shares. The fund uses 26% leverage and has an expense ratio of 1.8%, including interest payments. The distribution is 6.9%, consisting primarily of income with about 35% nondestructive ROC. Rationale for selecting . I liked the combination of REITs and Preferred stocks. Cohen and Steers has an excellent reputation in the real estate market. Kayne Anderson Energy Development ( KED ). This CEF is structured as a C-corporation and sells at a discount of 10.4%, which is very unusual for this fund, which has sold at an average premium of 0.2% over the past 3 years. The fund holds 59 securities, all MLPs, and utilizes 23% leverage. The expense ratio is 3.8% and the distribution rate is 5.9%, all from income with no ROC. Rationale for selecting . MLPs are one of my favorite income generators and Kayne Anderson specializes in this type of investments. I also like that the fund is currently selling at a relatively large discount. H&Q Healthcare Investor ( HQH ) : Over the past year, the price of this CEF has oscillated between a 4% premium and a 4% discount. Currently the fund is selling at a small premium of 0.6%. It has 83 holdings focused on healthcare, including biotechnology, medical devices, and pharmaceuticals. It does not use leverage but many of holdings are smaller, emerging companies. It has an expense ratio of 1.2% and the distribution rate is 8% with no ROC (the recent distributions have been funded by long and short term gains). Rationale for selecting. I think baby boomers reaching retirement will bode well for healthcare and biotech stocks. The fund also offers exposure to smaller companies, which I like. John Hancock Premium Dividend Fund (NYSE: PDT ) . This John Hancock fund is more diversified than a pure preferred stock fund. PDT consists of about 70% preferred stock and the rest is invested in dividend-paying equities. It is currently selling at a discount of 10.7%, which is below the 3 average discount of 6.5%. The fund has a distribution of 7.8%, none of which comes from ROC. It has 110 holdings, with the utility sector accounting for almost half of the total assets. The fund uses 33% leverage and has an expense ratio of 1.8%. Rationale for selecting. The management team has been together for over two decades and the fund has typically generated higher returns than its peers. I also like the emphasis on utilities. Fixed Income Focused CEFs Fixed income represents the ballast to temper the high volatility associated with equity funds. Despite the departure of Bill Gross, I am still a fan of PIMCO and believe they have the best breadth and experience in the fixed income field. PCM Fund (NYSE: PCM ). This CEF sells at a small discount of 0.4%, which is well below the 3 year average premium of 6.2%. The fund focuses on commercial mortgage backed securities and non-investment grade securities. It is relatively small for PIMCO funds, with only $185 million in assets. The portfolio is spread over 240 holdings, with 82% in mortgage backed bonds. About 35% of the holdings are investment grade. The fund utilizes 32% leverage and has an expense ratio of 2%. The distribution is 9%, with only a small (less than 10%) return of capital component. Rationale for selecting. I like mortgage backed securities since many of these have government guarantees. This is a good time to buy this fund without paying a premium. PIMCO Income Opportunity Fund (NYSE: PKO ) . This CEF currently sells at a discount of 1%, which is below the 3 year average premium of 2.9%. The portfolio has 470 holdings, allocated primarily among asset backed bonds (47%) and corporate bonds (43%). Only about 30% of the holdings are investment grade. The fund utilizes 38% leverage and has an expense ratio of 1.9%. The distribution is 8.3%, with only a small return of capital component. Rationale for selecting . I am a fan of David Ivascyn, who manages this fund. I also like the mix between asset backed and corporate bonds. Buying this fund at a discount is a definite plus. PIMCO Income Strategy Fund II (NYSE: PFN ) . This CEF currently sells at a discount of 2.3%, which is below the 3 year average premium of 1.8%. In 2010, the fund’s strategy was revamped to decrease the focus on floating-rate loans and enable the managers to invest in a wider range of fixed income assets. The fund invests in securities with durations in the low to intermediate range. The portfolio holds 206 securities with about 54% of the holdings being investment grade. The portfolio is spread among corporate bonds (25%), asset backed bonds (24%), Government bonds (21%), and floating rate loans (11%). The fund utilizes 20% leverage and has an expense ratio of 1.2%. The distribution is 9.5%, with no ROC over the past year. Rationale for selecting. The low duration will help insulate this fund if interest rates begin to rise. I also like the diversified bond portfolio and the fact that the fund is selling at a discount. NexPoint Credit Strategies (NYSE: NHF ). This CEF seeks both income and capital appreciation by investing in a combination of equities (55%), preferred stock (10%). senior loans (13%), bonds (22%). The fund managers have a flexible mandate and can invest in other assets and also hedge its holdings. The fund currently has a portfolio of 182 securities with about 93% of the companies being domiciled in the US. NHF currently sells at a large discount of 14.5%, which is more than its 3 year average discount of 11.4%. The fund utilizes 32% leverage and has an expense ratio of 2.7%. The distribution is 6.4%, consisting primarily of income, without any ROC. Rationale for selecting . I liked the flexibility provided to the managers of this fund even though the current allocation to equities is more than I would like for a fixed income holding (but this may change with market conditions). Overall, I liked the diversified nature of the portfolio, which contains some allocations to energy and precious metals which I expect may recover in 2015. CEF Composite Portfolio If you equal weight each of the selected CEFs, the resulting composite portfolio has the sector allocations shown graphically in Figure 1. Numerically the allocations are: 28.9% U.S equity, 4.2% REITs, 8.3% MLPs, 9.2% covered calls, 7.5% international equity. 28.4% bonds, and 2.7% floating rate loans. (click to enlarge) Figure 1 Sector composition of CEF portfolio The composite portfolio has an average distribution of 7.9%, which certainly meets my criteria for high income. But total return and risk are as important to me as income so I plotted the annualized rate of return in excess of the risk free rate (called Excess Mu in the charts) versus the volatility for each of the component funds. I used a look-back period from October 12, 2007 (the market high before the bear market collapse) to 30 December, 2014. The Smartfolio 3 program was used to generate this plot that is shown in Figure 2. (click to enlarge) Figure 2. Risks versus rewards over the bear-bull cycle. The plot illustrates that the CEFs have booked a wide range of returns and volatilities since 2007. To better assess the relative performance of these funds, I calculated the Sharpe Ratio. The Sharpe Ratio is a metric developed by Nobel laureate William Sharpe that measures risk-adjusted performance. It is calculated as the ratio of the excess return over the volatility. This reward-to-risk ratio (assuming that risk is measured by volatility) is a good way to compare peers to assess if higher returns are due to superior investment performance or from taking additional risk. In Figure 2, I plotted a red line that represents the Sharpe Ratio associated with the SPDR S&P 500 ETF (NYSEARCA: SPY ) . If an asset is above the line, it has a higher Sharpe Ratio than SPY. Conversely, if an asset is below the line, the reward-to-risk is worse than SPY. Over the bear-bull cycle, the individual CEFs were more volatile than SPY. However, the equally weighted composite portfolio had a volatility slightly (4%) less than SPY and a return substantially higher (over 30%) than SPY. This is an illustration of an amazing discovery made by an economist named Markowitz in 1950. He found that if you combined certain types of risky assets, you could construct a portfolio that had less risk than the components. His work was so revolutionary that he was awarded the Nobel Prize. The key to constructing such a portfolio was to select components that were not highly correlated with one another. In other words, the more diversified the portfolio, the more potential volatility reduction you can receive. Some other interesting observations evident from the figure are: A little over half the CEFs were above the red line indicating that the risk-adjusted returns were better than SPY. The specialty CEFs (HQH, RNP, and KED) were very volatile but compensated the investor for the increased risk. The high return of these components contributed to the excellent portfolio performance with diversification helping to tame the volatilities. Over the period, HQH had the best risk-adjusted performance and the fixed income CEFs (PFN and NHF) has the worst. I was a little surprised to see high volatility associated with the pure bond funds (PKO, PCM, and PFN). This was likely due to prices fluctuating between discounts and premiums. I next wanted to assess the diversification of this portfolio. To be “diversified,” you want to choose assets such that when some assets are down, others are up. In mathematical terms, you want to select assets that are uncorrelated (or at least not highly correlated) with each other. I calculated the pair-wise correlations associated with the funds. I also included SPY to assess the correlation of the funds with the S&P 500. The data is presented in Figure 3. As you might expect, the equity funds (JCE, ETW, SCD) were the most correlated with SPY (correlations in 80% to 85% range). The other equity funds were only moderately correlated with SPY and the bonds funds had low correlations below 50%. Among the CEFs, correlations ranged from low to moderate. Overall, these results were consistent with a well-diversified portfolio. (click to enlarge) Figure 3. Correlations over bear-bull cycle My next step was to assess this portfolio over a shorter timeframe when the S&P 500 was in a strong bull market. I chose a look-back period of 5 years, from December 2009 to December, 2014. The data is shown in Figure 4 and I was happy to see that the combined portfolio continued to outperform the S&P 500 during this bull market period. In fact, the portfolio booked a return that was 9% better than SPY with 20% less volatility. This was truly impressive performance! (click to enlarge) Figure 4. Risks versus rewards over past 5 years Based on the above, I wanted to see if the outperformance continued during the more recent past. I next used a look-back period of 3 years and the results are shown in Figure 5. As you might have anticipated, during the past 3 years the SPY outperformed most of the CEFs. Only NHF outperformed and two funds (HQH and JCE) were very close to the red line. However, when all these CEF performances were combined, the portfolio generated a return that was only slightly less (12%) than the S&P 500 (with a volatility that was also 12% less). The risk-adjusted return for the portfolio was actually better than SPY. Thus, I continued to be pleased with the portfolio performance during this bull market period. (click to enlarge) Figure 5. Risks versus rewards over past 3 years As a final test, I used the last 12 months as a look-back period and the results are shown in Figure 6. During this period, the portfolio far exceeded my expectations by handily beating SPY in terms of return by 13% with a volatility that was 13% less. As shown in the figure, the risk-adjusted return of the portfolio easily outperformed the SPY. (click to enlarge) Figure 6. Risks versus rewards over past 12 months Bottom Line The CEFs in this portfolio were all volatile, with some outperforming and other lagging depending on the time period. However, as a whole, the CEFs complemented one another to produce an exceptional portfolio that outperformed the SPY on a risk-adjusted basis in every timeframe analyzed. No one know how this portfolio will perform in the future but based on past history, I believe it is worthy of consideration for an income investor who is also seeking total return at a reasonable risk. Scalper1 News
Scalper1 News