Scalper1 News
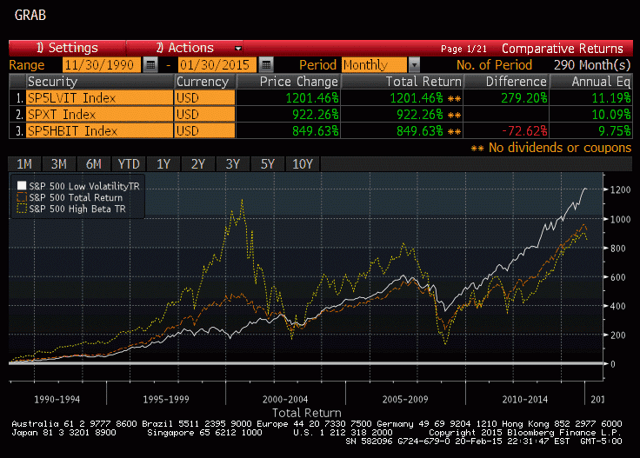
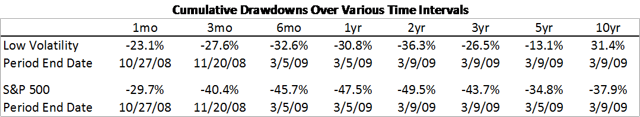 Low volatility equity strategies have been shown to have historically produced higher risk-adjusted returns, a violation of models that expect higher risk to be compensated with higher returns. Low volatility strategies have produced higher returns because they have outperformed in falling markets. This article details the lower maximum drawdowns of a low volatility strategy, showing the worst returns for the strategy over various time intervals versus the broader market. I have written a number of articles about the Low Volatility Anomaly , and how lower beta stocks have produced higher absolute and risk-adjusted returns than high beta stocks over time. The returns of the S&P Low Volatility Index, the S&P 500, and the S&P 500 High Beta Index since 1990 are compared below: (click to enlarge) Source: Bloomberg, Standard and Poor’s A tilt towards lower volatility stocks was one of my five strategies for outperformance for buy-and-hold investors . Low volatility strategies outperform because they suffer lower drawdowns in tough market environments, but capture most of the upside in bull markets , which is demonstrable in the graph above. In comments on a recent article, a reader queried about what the maximum drawdowns have been for low volatility equity strategies. Using data from the S&P Low Volatility Index (replicated by SPLV ), which measures the performance of the one-hundred least volatile components of the S&P 500, I have captured maximum drawdowns over various time horizons and compared these drawdowns to those of the S&P 500 Index (NYSEARCA: SPY ). (click to enlarge) Unsurprisingly, the worst drawdowns for the Low Volatility strategy and the broader equity market overlapped during the financial crisis. On average, the drawdown for the Low Volatility Index was only two-thirds to three-quarters of the broader market. Over ten year periods, the Low Volatility strategy have always produced positive returns, but this is an admittedly short dataset (1990-current), covering just three business cycle troughs. Disclaimer: My articles may contain statements and projections that are forward-looking in nature, and therefore inherently subject to numerous risks, uncertainties and assumptions. While my articles focus on generating long-term risk-adjusted returns, investment decisions necessarily involve the risk of loss of principal. Individual investor circumstances vary significantly, and information gleaned from my articles should be applied to your own unique investment situation, objectives, risk tolerance, and investment horizon. Disclosure: The author is long SPLV, SPY. (More…) The author wrote this article themselves, and it expresses their own opinions. The author is not receiving compensation for it (other than from Seeking Alpha). The author has no business relationship with any company whose stock is mentioned in this article. Scalper1 News
Scalper1 News