Scalper1 News
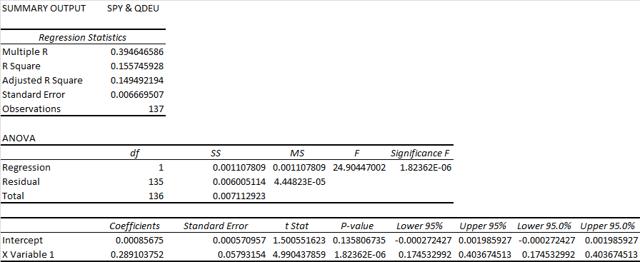
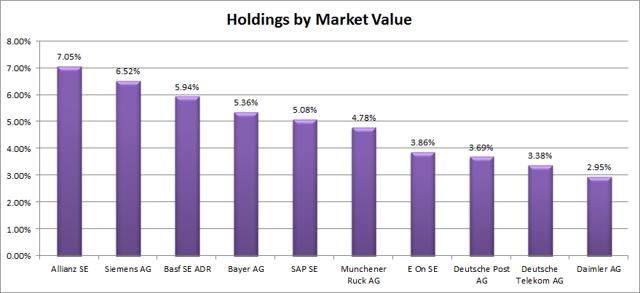 Summary I’m taking a look at QDEU as a candidate for inclusion in my ETF portfolio. The expense ratio relative to the diversification is unappealing. The extremely low correlation with other major funds (like SPY) is great, but could be related to the small sample size. The trading volume is low, but much higher than other international ETFs by the same source. I’m not assessing any tax impacts. Investors should check their own situation for tax exposure. Investors should be seeking to improve their risk adjusted returns. I’m a big fan of using ETFs to achieve the risk adjusted returns relative to the portfolios that a normal investor can generate for themselves after trading costs. I’m working on building a new portfolio and I’m going to be analyzing several of the ETFs that I am considering for my personal portfolio. One of the funds that I’m considering is the SPDR® MSCI Germany Quality Mix ETF (NYSEARCA: QDEU ). I’ll be performing a substantial portion of my analysis along the lines of modern portfolio theory, so my goal is to find ways to minimize costs while achieving diversification to reduce my risk level. What does QDEU do? QDEU attempts to track the total return of the MSCI Germany Quality Mix Index. Normally at least 80% of the assets are invested in funds included in this index, but there appears to be some leeway under unusual market conditions. QDEU falls under the category of “Miscellaneous Region”. Does QDEU provide diversification benefits to a portfolio? Each investor may hold a different portfolio, but I use the SPDR S&P 500 Trust ETF (NYSEARCA: SPY ) as the basis for my analysis. I believe SPY, or another large cap U.S. fund with similar properties, represents the reasonable first step for many investors designing an ETF portfolio. Therefore, I start my diversification analysis by seeing how it works with SPY. I start with an ANOVA table: (click to enlarge) The correlation is only 39%, which is great for modern portfolio theory. Extremely low levels of correlation are wonderful for establishing a more stable portfolio. I consider anything under 50% to be extremely low. Standard deviation of daily returns (dividend adjusted, measured since June 2014) The standard deviation is fairly high. For QDEU it is .9872%. For SPY, it is 0.7232% for the same period. SPY usually beats other ETFs in this regard, but SPY doesn’t usually beat them by this much. If the correlation fails to predict future levels of correlation, then this volatility could become an issue. Major risks The ETF has moderately low volume, but it is substantially higher than many of the SPDR® MSCI ETFs I have considered. The average volume has been running around 10,000 shares. This is still a low volume, but not as low as some of the ETFs I have covered. However, when I checked the daily return values I saw a problem. For having almost 10,000 shares per day trading hands, on average, the number of days in which the share price did not move by a cent was a problem. It appears that over the last few months this problem has started to get better. However, it still happened quite a few times in December. The days where no shares are being traded may cause the computed correlation and standard deviation to be inaccurate. Mixing it with SPY I also run comparisons on the standard deviation of daily returns for the portfolio assuming that the portfolio is combined with the S&P 500. For research, I assume daily rebalancing because it dramatically simplifies the math. With a 50/50 weighting in a portfolio holding only SPY and QDEU, the standard deviation of daily returns across the entire portfolio is 0.7178%. With 80% in SPY and 20% in QDEU, the standard deviation of the portfolio would have been .6811%. If an investor wanted to use QDEU as a supplement to their portfolio, the standard deviation across the portfolio with 95% in SPY and 5% in QDEU would have been .7080%. Why I use standard deviation of daily returns I don’t believe historical returns have predictive power for future returns, but I do believe historical values for standard deviations of returns relative to other ETFs have some predictive power on future risks and correlations. Yield & Taxes The SEC yield is 2.06%. That appears to be a respectable yield. At a 2% yield, this ETF could be worth considering for retiring investors, but only if they do not need to be concerned about liquidity. I’m not a CPA or CFP, so I’m not assessing any tax impacts. Expense Ratio The ETF is posting .30% for an expense ratio. I want diversification, I want stability, and I don’t want to pay for them. The expense ratio on this fund is higher than I want to pay for equity securities, but not high enough to make me eliminate it from consideration. Market to NAV The ETF is at a .54% premium to NAV currently. Premiums or discounts to NAV can change very quickly so investors should check prior to putting in an order. I don’t want to pay a premium over .2%, so I would only consider entering through a limit order that required a slightly lower price. Largest Holdings The diversification within the ETF is bad. The top 10 securities represent 48.61% of the portfolio’s value. That’s pretty terrible for an ETF. I’m not pleased with the diversification. (click to enlarge) Conclusion I’m currently screening a large volume of ETFs for my own portfolio. The portfolio I’m building is through Schwab, so I’m able to trade QDEU with no commissions. I have a strong preference for researching ETFs that are free to trade in my account, so most of my research will be on ETFs that fall under the “ETF OneSource” program. The low correlation looks good and the liquidity, despite being low, isn’t low enough to risk scaring me off. The weak diversification combined with the moderate to high expense ratio leaves me feeling that as an investor I deserve more. I’ll consider QDEU, but I may also need to look into their expense ratio and see what they are doing to earn it. Additional disclosure: Information in this article represents the opinion of the analyst. All statements are represented as opinions, rather than facts, and should not be construed as advice to buy or sell a security. Ratings of “outperform” and “underperform” reflect the analyst’s estimation of a divergence between the market value for a security and the price that would be appropriate given the potential for risks and returns relative to other securities. The analyst does not know your particular objectives for returns or constraints upon investing. All investors are encouraged to do their own research before making any investment decision. Information is regularly obtained from Yahoo Finance, Google Finance, and SEC Database. If Yahoo, Google, or the SEC database contained faulty or old information it could be incorporated into my analysis. The analyst holds a diversified portfolio including mutual funds or index funds which may include a small long exposure to the stock. Scalper1 News
Scalper1 News