Scalper1 News
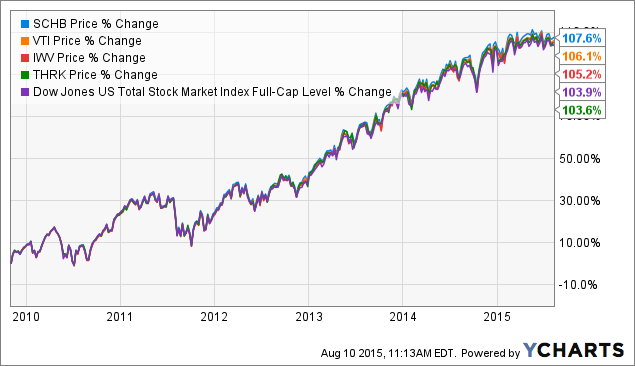
 Summary A low expense total market ETF ought to be the cornerstone of a well-diversified portfolio. I will compare several well-known ETFs and ultimately make a recommendation. I will make a comparison on these metrics: expense, # of holdings, volume, yield, historical performance, and correlation. Introduction As a long term investor, I believe a low expense total stock market ETF should be a core holding in a diversified portfolio. Total stock market ETFs are designed to passively track the entire market by maintaining a large basket of small, mid, and large cap equities. These ETFs mitigate single stock risk and generally provide attractive dividends. Total stock market ETFs are invaluable for providing investors with exposure to strong equities within sectors they may not understand well. The best ETFs have low expense ratios (as to not siphon of long-term returns), and hold a well-weighted, liquid, basket of equities. ETF Contenders The Four ETFs I will compare are as follows: the Vanguard Total Stock Market ETF (NYSEARCA: VTI ), the Charles Schwab U.S. Broad Market ETF (NYSEARCA: SCHB ), the iShares Russell 3000 ETF (NYSEARCA: IWV ), and the SPDR Russell 3000 ETF (NYSEARCA: THRK ). Historical Correlation For an ETF like this, you want to see a long term correlation between the total market and historical returns. If this was a short term play (a leverage ETF, ETN, Ect.) I would go more in depth. In this case I graphed out 10 years of past performance (% change), and each ETF appears adequately correlated. SCHB and VTI appear to have the best total returns, and perhaps they are weighted the best (or most aggressively). Comparing Key Metrics Total Market – Key Metrics VTI SCHB IWV THRK Total Assets 56.22 Bil 4.99 Bil 6.24 Bil 248.92 Mil # of Holdings 3,814 2,018 3,008 2,509 P/E Ratio 21.7 X 19.3 X 19.97 X 17.70 X Avg. Volume 2.7 Mil 518,431 252,213 18,437 Expense 0.05% 0.04% 0.20% 0.10% SEC Yield 1.88% 1.81% 1.69% 1.77% Biggest Concern The aforementioned P/E ratios paint a larger picture of the overall market. The averaged out P/E multiple for the market is roughly 20X which indicates the market may be moving towards “overvalued” territory. I wrote previously that overall market returns average about 10% annually, but they also range from 5%-18% annually (averaged over a 20 year time frame). While returns over the last 5 years have been close to 12% annually, they may taper off to the lower range of historical returns. There could even be a short-term market correction. For this reason, I want to reiterate the importance of maintaining a long term horizon. Side note, it may soon become difficult to find opportunities for significant capital appreciation going forward. THRK The SPDR Russell 3000 ETF is the smallest of the four ETFs. THRK is not the cheapest, and it does not have as much liquidity as other options. Its small asset base is not optimal in comparison to relevant alternatives. THRK needs to grow to compete with iShares, Schwab, and Vanguard. IWV The iShares Russell 3000 has the highest expense ratio, but it does have some notable characteristics that differentiate it. IWV has unbiased exposure and large number of holdings. IWV additionally maintains a large percentage of small-cap stocks that gives it increased diversification and risk/reward. IWV’s low yield and low comparable liquidity, however, makes me believe their are better options. SCHB The Schwab U.S. Broad Market ETF is the cheapest option on the market (0.04%). It offers an attractive 1.81% SEC yield, but it excludes a number of micro-caps (decreasing reward and diversification benefits). It is very liquid, but not the most liquid, and SCHB holds the fewest equities of all four ETFs. VTI The Vanguard Total Stock Market ETF is the most traded of the four ETFs. VTI has the most AUM and a micro expense ratio (0.05% only 0.1% more than SCHB). Additionally, VTI holds the largest basket of equities giving it broad diversification and optimal market exposure. VTI currently has the highest SEC yield as well (1.88%). Recommendation I believe VTI and SCHB are the two best total market ETFs on the market. Of those two, I believe VTI is slightly better than SCHB because is provides more total market exposure and more liquidity. I would recommend a long position in VTI. I would also establish a dividend reinvestment plan (if possible) to increase the compounding effect over time. Disclosure: I/we have no positions in any stocks mentioned, and no plans to initiate any positions within the next 72 hours. (More…) I wrote this article myself, and it expresses my own opinions. I am not receiving compensation for it (other than from Seeking Alpha). I have no business relationship with any company whose stock is mentioned in this article. Scalper1 News
Scalper1 News