Scalper1 News
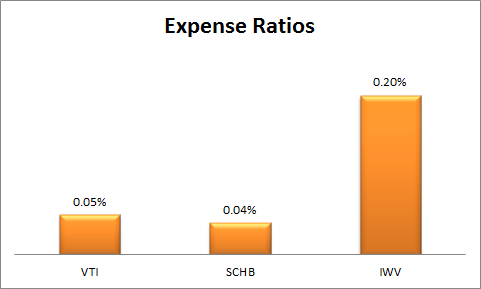
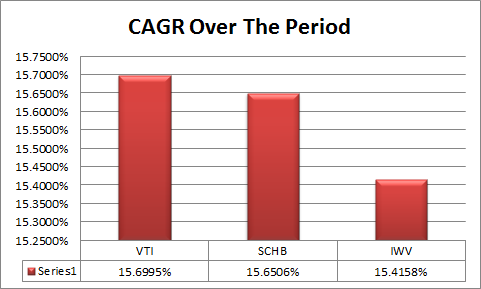
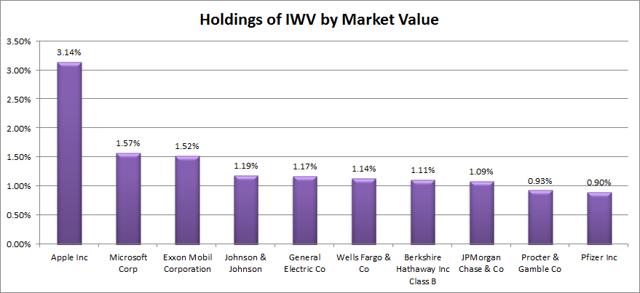
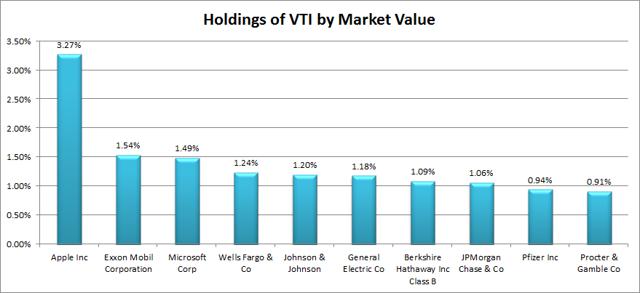
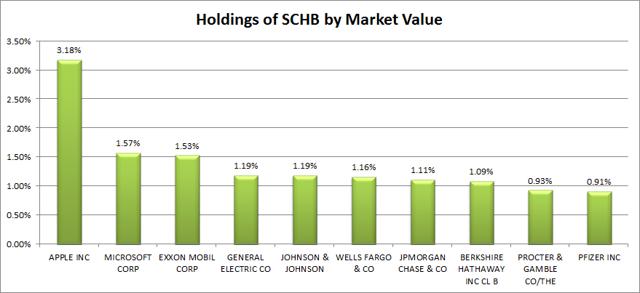 Summary IWV has delivered very similar returns to those of VTI and SCHB in previous periods. The holdings are fairly similar throughout the ETFs, except IWV offers a higher expense ratio. Over the long term, it will be difficult for IWV to beat VTI or SCHB due to the slightly higher expense ratios. The iShares Russell 3000 Index ETF (NYSEARCA: IWV ) is a great barometer for the performance of the U.S. market. The fund offers investors excellent diversification and should be a solid long-term investment. There is only one problem with IWV; it has been surpassed by Vanguard and Charles Schwab offering extremely similar funds with lower expense ratios. That’s too bad for IWV, since the ETF’s expense ratio of .20% is still much better than the average. Looking at returns since the Schwab U.S. Broad Market ETF (NYSEARCA: SCHB ) was introduced and reinvesting all dividends, IWV has struggled to keep up. The Schwab U.S. Broad Market ETF and the Vanguard Total Stock Market ETF (NYSEARCA: VTI ) have steadily outperformed by a small amount. Over about five and a half years, IWV is up 120%, but SCHB is up 122.5% and VTI is up 123%. I put together a chart comparing the expense ratios of the ETFs. Even though .20% isn’t high for an ETF, it is high compared to the best options in the space. The .15% per year would be .825% over the span of 5 years. Unfortunately, IWV has trailed by more than the expense ratio. However, it has explained a significant portion of the difference in these extremely similar ETFs. The following chart turns the total returns into a CAGR (compound annual growth rate), which makes it easier to compare the difference in returns on an annual basis with the annual expense ratios. IWV was underperforming SCHB by about .22% annually and VTI by .27% annually. When you consider a difference in expense ratios of about .15%, it is more than half of the difference. They can’t deviate too far The returns of the Vanguard Total Stock Market ETF, the Schwab U.S. Broad Market ETF, and the iShares Russell 3000 Index ETF are going to be highly correlated for the foreseeable future, because the ETFs have very similar portfolios. Since the underlying securities are very similar, the ETFs should remain very similar, except for the long-term drag caused by the expense ratio. Holdings The charts below show the top 10 holdings for each ETF. (click to enlarge) (click to enlarge) (click to enlarge) When you look at the holdings, there is a lot of similarity between IWV and SCHB. VTI has more differences in the portfolio, but the holdings are still extremely similar. All three have the same top ten companies and when they are in different orders the difference in the allocations is still extremely small. Will IWV go up? I would certainly expect IWV to increase in value over the years. The correlation is going to be phenomenally high with ETF’s like VTI that I have selected as core holdings for my portfolio. However, if I had the option to short IWV with no maintenance costs on the position outside any dividends and could put the cash from the short into VTI or SCHB, I would happily make the trade and leverage it in an attempt to benefit from the difference in expense ratios. If your brokerage only allowed investing in ETFs and neither VTI nor SCHB was available, IWV would be a viable option. However, if I were in a situation like that, I’d be looking for any way to change the brokerage. The strangest conclusion I’ve found myself writing I expect IWV to see substantial growth over the years as a diversified investment in the U.S. economy, but I also expect it to consistently underperform SCHB and VTI. For purposes of tagging my expectations for positive returns compared to cash, I’d have to put down a “buy” rating. However, under all conceivable circumstances, I would rather buy SCHB or VTI. If markets were really efficient and there were no costs on trading (frictionless markets), I’d be shorting IWV to go long SCHB and expecting the position to be market-neutral (beta of 0) and to produce alpha around .15-.16% per year based on the total dollar value of the positions. Disclosure: I/we have no positions in any stocks mentioned, and no plans to initiate any positions within the next 72 hours. (More…) I wrote this article myself, and it expresses my own opinions. I am not receiving compensation for it (other than from Seeking Alpha). I have no business relationship with any company whose stock is mentioned in this article. Additional disclosure: Information in this article represents the opinion of the analyst. All statements are represented as opinions, rather than facts, and should not be construed as advice to buy or sell a security. Ratings of “outperform” and “underperform” reflect the analyst’s estimation of a divergence between the market value for a security and the price that would be appropriate given the potential for risks and returns relative to other securities. The analyst does not know your particular objectives for returns or constraints upon investing. All investors are encouraged to do their own research before making any investment decision. Information is regularly obtained from Yahoo Finance, Google Finance, and SEC Database. If Yahoo, Google, or the SEC database contained faulty or old information it could be incorporated into my analysis. Scalper1 News
Scalper1 News