Scalper1 News
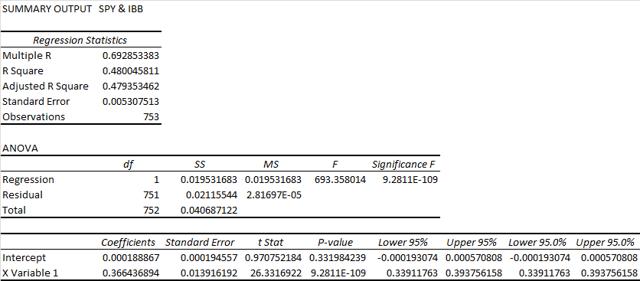
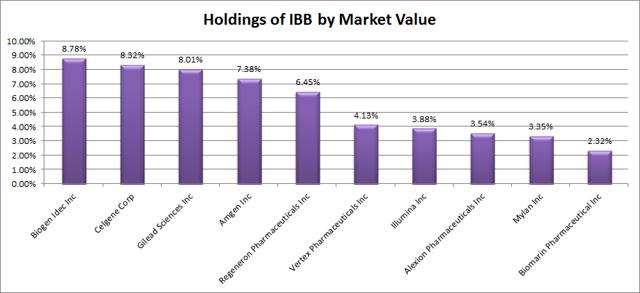 Summary IBB has a respectably low correlation to SPY, but the ETF is quite volatile on its own. The ETF doesn’t make sense for investors that are retiring, but it works fine for investors not seeking yield. I’d rather see lower expense ratios, but they aren’t bad enough to make the ETF unattractive. I’ll share my findings on ideal exposure levels. Investors should be seeking to improve their risk adjusted returns. I’m a big fan of using ETFs to achieve the risk adjusted returns relative to the portfolios that a normal investor can generate for themselves after trading costs. I’m working on building a new portfolio and I’m going to be analyzing several of the ETFs that I am considering for my personal portfolio. A substantial portion of my analysis will use modern portfolio theory, so my goal is to find ways to minimize costs while achieving diversification to reduce my risk level. In this article I’m reviewing the iShares Nasdaq Biotechnology ETF (NASDAQ: IBB ). What does IBB do? IBB attempts to track the investment results of an index composed of pharmaceutical and biotechnology equities. The ETF falls under the category of “Health”. Does IBB provide diversification benefits to a portfolio? Each investor may hold a different portfolio, but I use (NYSEARCA: SPY ) as the basis for my analysis. I believe SPY, or another large cap U.S. fund with similar properties, represents the reasonable first step for many investors designing an ETF portfolio. Therefore, I start my diversification analysis by seeing how it works with SPY. I start with an ANOVA table: (click to enlarge) The correlation is about 69%, which is low enough that I’m expecting to see significant diversification benefits. Standard deviation of daily returns (dividend adjusted, measured since January 2012) The standard deviation isn’t going to make a strong case for investing in IBB. For the period I’ve chosen, the standard deviation of daily returns was 1.391 %. For SPY, it was 0.736% over the same period. Clearly, SPY appears to be the safer of the two investments. Mixing it with SPY I also run comparison on the standard deviation of daily returns for the portfolio assuming that the portfolio is combined with the S&P 500. For research, I assume daily rebalancing because it dramatically simplifies the math. With a 50/50 weighting in a portfolio holding only SPY and IBB, the standard deviation of daily returns across the entire portfolio is 0.987%. The risk level on the portfolio drops relative to only holding SPY because of the diversification benefits that come from the 69% correlation. If the position in SPY is raised to 80% while IBB is used at 20% the standard deviation of daily returns drops down to 0.807%. In practice, I think the best way to use IBB is a position smaller than 20% and used in a diversified portfolio. The low correlation makes a very strong case for using IBB in a small position to enhance diversification. I would lean to limiting exposure to around 5%. At 5%, the standard deviation of the portfolio would have been 0.749%. Compared to SPY at .736%, this is a fairly low increase in the risk level measured by the standard deviation. Most of the additional deviation introduced by IBB has been effectively diversified away once the position hits 5% in a portfolio that is primarily SPY. Why I use standard deviation of daily returns I don’t believe historical returns have predictive power for future returns, but I do believe historical values for standard deviations of returns relative to other ETFs have some predictive power on future risks and correlations. Yield & Taxes The distribution yield is .15%. Simply put, the ETF doesn’t make much sense for a retiring investor that wants to use portfolio yields as a large part of their retirement income. Sure, they could sell shares to generate income, but that may create a temptation to change the portfolio strategy at the wrong time. Expense Ratio The ETF is posting .48% for an expense ratio, which is higher than I’d like to see. Unfortunately, most ETFs have expense ratios higher than I’d like to see. This isn’t bad compared to other ETFs, though it is substantially higher than SPY at .09%. Market to NAV The ETF is trading at a .01% premium to NAV currently. I think any ETF is significantly less attractive when it trades above NAV. A .01% premium is not enough to matter though. Investors should check prior to placing an order, but the liquidity in IBB should be a great hedge against any meaningful premiums or discounts. Largest Holdings The diversification within the ETF is pretty weak. For a very long term holder it might make sense to replicate the ETF by just buying the underlying securities and taking higher trading costs to eliminate the expense ratio. (click to enlarge) Investing in the ETF is largely relying on modern portfolio theory. The argument for the investment is the respectably low correlation of the portfolio to the major U.S. index funds. Making an investment requires a belief that markets are at least somewhat efficient so that the companies within the portfolio will be reasonably priced. Conclusion The trading volume for the ETF is fairly solid. Recently the average volume was about 1.7 million shares per day. During my three year sample period there were 0 days in which no shares were trading hands. Based on that solid liquidity, I think the statistics are fairly reliable and find the ETF appealing under modern portfolio theory if investors have a large enough portfolio have less than 5% invested in IBB and still have the position be meaningful. Due to the small percentage of the portfolio that I would suggest for such a volatile portfolio, it makes more sense for investors that have access to some free trading on IBB or investors that have a portfolio large enough that the trading costs are inconsequential. The ETF has been on a tear over the last 3 years. During the period the ETF is up about 190%, but since it still trades at NAV that is simply reflecting the incredible growth of the underlying companies. Investors doing some quick research may see that the Beta of the ETF is .83. That value depends on measuring the ETF relative to a benchmark associated with the index rather than comparing the risk level to SPY. Scalper1 News
Scalper1 News