Tag Archives: yahoo

Today’s Strongly Competitive Wealth-Builder Sector ETF Investment

Summary From a population of some 350 actively-traded, substantial, and growing ETFs, this is a currently attractive addition to a portfolio whose principal objective is wealth accumulation by active investing. We daily evaluate future near-term price gain prospects for quality, market-seasoned ETFs, based on the expectations of market-makers [MMs], drawing on their insights from client order-flows. The analysis of our subject ETFs’ price prospects is reinforced by parallel MM forecasts for each of the ETF’s ten largest holdings. Qualitative appraisals of the forecasts are derived from how well the MMs have foreseen subsequent price behaviors following prior forecasts similar to today’s. Size of prospective gains, odds of winning transactions, worst-case price drawdowns, and marketability measures are all taken into account. Today’s most attractive ETF Today’s most attractive ETF is the SPDR S&P Retail ETF (NYSEARCA: XRT ). The investment seeks to provide investment results that, before fees and expenses, correspond generally to the total return performance of an index derived from the retail segment of a U.S. total market composite index. In seeking to track the performance of the S&P Retail Select Industry Index (the “index”), the fund employs a sampling strategy. It generally invests substantially all, but at least 80%, of its total assets in the securities comprising the index. The index represents the retail industry group of the S&P Total Market Index (“S&P TMI”). The fund is non-diversified (Description from Yahoo Finance) Figure 1 (used with permission) The vertical lines of Figure 1 are a visual history of forward-looking expectations of coming prices for the subject ETF. They are not a backward-in-time look at actual daily price ranges, but the heavy dot in each range is the ending market quote of the day the forecast was made. What is important in the picture is the balance of upside prospects in comparison to downside concerns. That ratio is expressed in the Range Index [RI], whose number tells what percentage of the whole range lies below the then current price. Today’s Range Index is used to evaluate how well prior forecasts of similar RIs for this ETF have previously worked out. The size of that historic sample is given near the right-hand end of the data line below the picture. The current RI’s size in relation to all available RIs of the past 5 years is indicated in the small blue thumbnail distribution at the bottom of Figure 1. The first items in the data line are current information: The current high and low of the forecast range, and the percent change from the market quote to the top of the range, as a sell target. The Range Index is of the current forecast. Other items of data are all derived from the history of prior forecasts. They stem from applying a T ime- E fficient R isk M anagement D iscipline to hypothetical holdings initiated by the MM forecasts. That discipline requires a next-day closing price cost position be held no longer than 63 market days (3 months) unless first encountered by a market close equal to or above the sell target. The net payoffs are the cumulative average simple percent gains of all such forecast positions, including losses. Days held are average market rather than calendar days held in the sample positions. Drawdown exposure indicates the typical worst-case price experience during those holding periods. Win odds tells what percentage proportion of the sample recovered from the drawdowns to produce a gain. The cred(ibility) ratio compares the sell target prospect with the historic net payoff experiences. Figure 2 provides a longer-time perspective by drawing a once-a week look from the Figure 1 source forecasts, back over two years. Figure 2 (used with permission) What does this ETF hold, causing such price expectations? Figure 3 is a table of securities held by the subject ETF, indicating its concentration in the top ten largest holdings, and their percentage of the ETF’s total value. Figure 3 source: Yahoo Finance XRT apparently takes a low-concentration approach to holdings, with an average of 1¼% of its assets in each of its top ten commitments. This provides a wide dispersion of holdings among competitive investment contestants in an industry where success rewards can be huge, while failures may be complete. If the remaining 88% of assets are distributed on a comparable basis 99 separate bets may be being made, offering great diversification, as well as dilution of encountered bonanzas. Where ultimate payoffs are less dependent on initial capital commitment size, this may be an advantaged strategy. Figure 4 is a table of data lines similar to that contained in Figure 1, for each of the top ten holdings of XRT. Figure 4 (click to enlarge) In an industry as unpredictably dynamic as this, wide variations in market experience seem to be the rule. Column (5) contains the upside price change forecasts between current market prices and the upper limit of prices regarded by MMs as being worth paying for price change protection. The average of +10.2% of the top ten XRT holdings is near the population average of all 2600+ equities MM forecasts of +13.4%. It is about double the upside forecast for SPY price change prospects. The other side of the coin is column (6), which shows what actual worst-case price drawdowns have been typical in the 3 months following each time there has been a forecast like those of the present day. Those risk exposures have been about -7% in the holdings top ten, less than -9 by equities at large, and only -3.2% on the SPY ETF. But these holdings are attractive reward tradeoffs between returns and risks, with the top ten (column 14) at a ratio of 1.4, compared to equities overall at 1.6 times. The market average of SPY provides a ratio of 1.6 times risk avoidance. Another qualitative consideration is the credibility of the ten XRT big holdings after previous forecasts like today’s. The net average price change (column 13) of the ten has been only 0.5 times the size of the upside forecast average, +4.8% compared to +10.2%. The equity population’s actual price gain achievement, net of losses has been a pitiful +3.3% compared to promises of 13.4%. The ability of XRT holdings to recover from those worst-case drawdowns and achieve profits occurred in 75% of experiences. The equity population only recovered less than two thirds of the time, and while the SPY experiences were more consistent like the ten XRT holdings, the achieved gains were much smaller. SPY has had only +3.2% gains previously from like forecasts of +5.2%. The 20 top prospective equities from our overall equity population have superior credentials historically, given the past performance of present MM price range outlooks. Their reward-risk score of 1.8 is the highest of the four blue row averages. Their price recovery ability at 89% contributes mightily to their upside price forecast credibility and their % payoff achievement. Moving to targets more quickly than others has generated annual rates of gain (11) three times the XRT holdings and five times the rate of the population and market average. Conclusion XRT provides competitive forecast price gains in comparison to many other sector ETFs, supported by the outlooks for their largest holdings. Both the ETF and many of its major holdings offer strong prospects in near-term price behaviors, demonstrated by previous experiences following prior similar forecasts by market makers. In a market environment many consider to be at risk they present a reasonable defensive alternative. Disclosure: I/we have no positions in any stocks mentioned, and no plans to initiate any positions within the next 72 hours. (More…) I wrote this article myself, and it expresses my own opinions. I am not receiving compensation for it (other than from Seeking Alpha). I have no business relationship with any company whose stock is mentioned in this article.
VTSAX: An Excellent Mutual Fund For Passive Investing

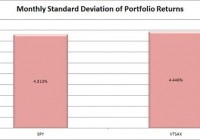
Summary VTSAX offers slightly more diversification than SPY, but it is also slightly more volatile. Because this is a total market fund, it has large weightings for the S&P 500 that create an extremely high correlation. VTSAX is one of the best mutual funds an investor can use for eligible employer-sponsored retirement accounts. Not all plans will offer this fund. VTSAX is the mutual fund version of VTI, which is one of the best total market ETFs available. Investors should be seeking to improve their risk-adjusted returns. Regardless of how they are handling the holdings, the goal is to maximize returns and minimize risks. When it comes to maximizing the returns while maintaining excellent diversification, Vanguard Total Stock Market Index Fund Admiral Shares (MUTF: VTSAX ) is an excellent option. My employer-sponsored retirement accounts are through different brokerages. Mine goes through Schwab, and my wife’s account is with Fidelity. Neither of us is eligible to use VTSAX, but I look for funds that replicate VTSAX, because it embodies most of the things I want in a fund. What does VTSAX do? VTSAX uses an indexing approach to track the performance of the CRSP U.S. Total Market Index. The first thing I’m looking for is diversification, so a total market index seems very attractive. Standard deviation of monthly returns (dividend adjusted, measured since January 2001) The standard deviation is not a problem. Because this is a total market index investors should expect it to be a little more volatile than the S&P 500, and that is exactly what we see. (click to enlarge) Basically, the increase in standard deviation is equivalent to having three percent leverage on a position in SPY. I love low-volatility investments, but when using a retirement account with dollar cost averaging automatically involved, a tiny bit of extra volatility is not problematic as long as the investment is very heavily diversified. Expense Ratio The Admiral shares have an expense ratio of .05%. This is excellent. Largest Holdings The diversification is very good in this mutual fund, and this is easily my favorite thing about the fund. The top 10 holdings appear to be somewhat concentrated, but when you consider that there are over 3800 different securities in the total portfolio, it doesn’t concern me. This is simply a great fund, in my opinion. (click to enlarge) Avoiding Fees There is one downside to Vanguard mutual funds. Vanguard charges a $20 annual account service fee for each mutual fund held in the account with a balance of less than $10,000. If you’re picking VTSAX for a new retirement account and want to save the $20, you can sign up on the Vanguard website for electronic delivery of statements. It appears to me that this fee is largely covering the cost of mailing the investments documents through the postal service. With its huge system in place, being able to send everything by one automated e-mail system saves the company money. I don’t see how it could hold its expense ratio down to .05% without having a way to compel investors to either take electronic delivery or pay for the physical copies. All around, this is a nicely designed system. Want VTSAX from Other Brokerages? You can also effectively invest in the fund using the Vanguard Total Stock Market ETF (NYSEARCA: VTI ), which holds the same assets and has the same expense ratio. Using VTI should automatically avoid the $20 fee and doesn’t require signing up the electronic delivery. The downside about using the ETF is that you would usually be stuck purchasing entire shares. While VTI, shares have been running $107-110; for dollar cost averaging, it is more convenient to be able to buy into a mutual fund with automatic deposits. Conclusion I like VTSAX enough that I’m holding a significant chunk of my portfolio in VTI, the ETF version. Lately, I had been adding to my cash positions rather than my equity positions, because I’m concerned about the market getting a little frothy. Over the last week, I dropped quite a bit of that into buying more broad market ETFs and mREITs when prices dipped. When it comes to long-term investing strategy for the employer-sponsored 401k accounts, my favorite technique is still to use dollar cost averaging on low-fee index funds and to max out (or come close) the contributions every year. If you really want to use VTSAX for your 401k, but are going through Fidelity, I would suggest looking into the Fidelity Spartan® Total Market Index Fund (MUTF: FSTVX ). That is the major mutual fund that I’m using for my wife’s 401k. It has slightly less holdings, with around 3,400 to 3,500 rather than 3,800, but is close enough for my purposes. The correlation between FSTVX and VTSAX is in excess of 99%. Disclosure: I am/we are long VTI, FSTVX. (More…) I wrote this article myself, and it expresses my own opinions. I am not receiving compensation for it (other than from Seeking Alpha). I have no business relationship with any company whose stock is mentioned in this article. Additional disclosure: Information in this article represents the opinion of the analyst. All statements are represented as opinions, rather than facts, and should not be construed as advice to buy or sell a security. Ratings of “outperform” and “underperform” reflect the analyst’s estimation of a divergence between the market value for a security and the price that would be appropriate given the potential for risks and returns relative to other securities. The analyst does not know your particular objectives for returns or constraints upon investing. All investors are encouraged to do their own research before making any investment decision. Information is regularly obtained from Yahoo Finance, Google Finance, and SEC Database. If Yahoo, Google, or the SEC database contained faulty or old information it could be incorporated into my analysis.

I Love This ETF: Vanguard Emerging Markets Government Bond Index ETF

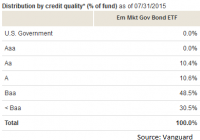
Summary VWOB offers investors exposure to the bond market for government debt in emerging markets. The portfolio has some substantial credit risk, but the yields and duration are solid. When the ETF is combined with other investments in a diversified portfolio, the low correlation is very attractive. I see this as a very solid holding for 3% to 5% of the portfolio. The Vanguard Emerging Markets Government Bond Index ETF (NASDAQ: VWOB ) is a very interesting bond fund. As I’ve been searching for appealing bond funds, I’ve found some of my favorites are from Vanguard. Given my distaste for high expense ratios, it should be no surprise that the Vanguard products would be appealing. After looking through the portfolio, I think the holdings are fairly reasonable for an investor wanting to regularly keep part of their portfolio in a bond fund. However, using only VWOB for bond exposure in a portfolio would be a very unwise decision. VWOB is designed to be an incredible supporting bond fund within a portfolio that already contains other bond investments. Quick Introduction The Vanguard Emerging Markets Government Bond Index ETF is showing a yield to maturity of 5.5% and an average duration of 5.7 years. Given the short duration on the portfolio and the very attractive yield on the bonds, it should be no surprise that the portfolio is carrying a substantial amount of credit risk. The emerging market governments don’t carry stellar credit ratings and there is definitely a material amount of risk in using the bond ETF as an investment. Credit Quality The following chart breaks down the credit quality of the issues being held in the portfolio. Clearly, a substantial portion of the holdings has fairly notable defects in their credit rating; however, the portfolio still offers investors diversification for their portfolio that can be very difficult to acquire in other ways. Emerging Markets and Other The holdings are primarily labeled as Emerging Markets; however, there is also a substantial allocation to a category labeled simply as “Other.” Investors should recognize that areas like Europe have zero allocation in the portfolio. See the chart below: The reason the allocations are so important is this exposure suggests that the portfolio’s correlation with other international bond funds might not be as high. That means even if the ETF is fairly volatile by itself, there could be some very substantial benefits to using it within a highly diversified portfolio that includes equity securities and bond funds allocated to different sectors, regions, and durations. Maturities I grabbed another chart to show the effective maturity on the securities: The maturity profile for the Vanguard Emerging Markets Government Bond Index ETF is fairly reasonable for an investor trying to get a solid diversification across the yield curve. There is a notable amount of exposure to the long-term bonds and the 5- to 10-year range. On the other hand, there is very little exposure to the shortest part of the yield curve. For optimal diversification, an investor may want to include other funds that target the shorter rate part of the yield curve. Risk Measuring returns and statistics since June of 2013 indicates that the portfolio is fairly stable for being invested in emerging markets. The annualized volatility of returns was 5.9%. For comparison, the annualized volatility on the S&P 500 for that period was 11.3% and the annualized volatility for the Vanguard FTSE Emerging Markets ETF (NYSEARCA: VWO ) was 18.3%. Correlation The fund really starts to shine when we consider the correlation in returns between VWOB and other bond funds that the investor might use for a larger portion of their exposure. Look at the correlation matrix below for a comparison: The Vanguard Total International Bond ETF (NASDAQ: BNDX ) is significantly less volatile than VWOB, but the correlation to BNDX is only 28%. BNDX, unlike VWOB, carries a heavy emphasis on Europe, which is entirely absent from the VWOB portfolio. In my opinion, these two ETFs held together in a portfolio are significantly better than either one alone due to the low correlation. Conclusion As far as bond ETFs go, the Vanguard Emerging Markets Government Bond Index ETF is a fairly solid option. An investor that failed to diversify into multiple funds would be taking more risk than necessary to realize returns, but when VWOB is used to enhance the diversification of the portfolio, it is an exceptional ETF. There are only two weaknesses in the entire ETF. One is that the expense ratio of .34% is higher than I want to pay and the other is that the ETF isn’t on the free-to-trade list for Schwab accounts. For investors that have free trading on VWOB through their brokerage and are willing to rebalance their portfolios to take advantage of the low correlations, it would seem that VWOB should be a natural choice for a small portion of the portfolio. My estimate is that the ETF would be a great holding at around 3% to 5% of the total portfolio value. Disclosure: I/we have no positions in any stocks mentioned, and no plans to initiate any positions within the next 72 hours. (More…) I wrote this article myself, and it expresses my own opinions. I am not receiving compensation for it (other than from Seeking Alpha). I have no business relationship with any company whose stock is mentioned in this article. Additional disclosure: Information in this article represents the opinion of the analyst. All statements are represented as opinions, rather than facts, and should not be construed as advice to buy or sell a security. Ratings of “outperform” and “underperform” reflect the analyst’s estimation of a divergence between the market value for a security and the price that would be appropriate given the potential for risks and returns relative to other securities. The analyst does not know your particular objectives for returns or constraints upon investing. All investors are encouraged to do their own research before making any investment decision. Information is regularly obtained from Yahoo Finance, Google Finance, and SEC Database. If Yahoo, Google, or the SEC database contained faulty or old information it could be incorporated into my analysis.