Tag Archives: yahoo

Pampa Energía Is A Good Option For Normalization In Argentina

Summary Pampa Energía works in a highly distorted regulatory framework, where frozen tariffs have led to a critical situation for the utility companies. Even in this scenario Pampa Energía has managed to reach a price earning of 5 years. With a new government about to be elected, great improvements could be in the way. Pampa Energía S.A. (NYSE: PAM ) is the largest integrated electricity company in Argentina and through its subsidiaries participates in the generation, transmission and distribution of electricity, as well as natural gas transportation and production. (click to enlarge) Source: Pampa Energía. Pampa Energía owns indirectly: 84% of the generation assets. 26% of the transmission business (TRAN.BA). 52% of the distribution business with Edenor (EDN). 26% of the natural gas transportation business with Transportadora de Gas del Sur (NYSE: TGS )(pending government approval). 50% of the Oil and Gas exploration and production business with Petrolera Pampa (PETR.BA), associated with Yacimientos Petrolíferos Fiscales (YPF). As of August 17th, 2015 the market cap of the above mentioned: (click to enlarge) Source: Yahoo Finance Reminder: Transener and Petrolera Pampa stocks are only listed in the Merval Index, the market cap is expressed in Argentine Pesos -AR$-. Exchange rate as of August 17th: ARS/USD= 9.15. Updated quotes and market cap expressed in USD here . Scenario: Pampa Energía works in a highly distorted regulatory framework where frozen tariffs have led to a critical situation for the utility companies. From 2001 onwards the tariff was converted to AR$ and had practically no adjustments and no longer provides for a reasonable return on capital/assets. Full tariff reviews are pending. High inflation and regulated tariffs that took place since 2006 and 2001 respectively, have led to deep margin erosion for utility stocks. The Argentine utility stocks have underperformed their Latam and EM peers since 2001, these poor returns are explained by significant erosion in real electricity tariffs (frozen since 2001). Gross margin captured by utilities as a percentage of the GDP fall from 0.3% to 0.02%, setting the scope for a possible recovery in profits, if the upcoming political situation leads to a normalization of the current imbalances. For example, the comparison between the residential electricity cost in Argentina and regional peers shows clearly how distorted the public services tariffs are. (click to enlarge) Source: Pampa Energía. Subsidies for electricity and gas purchases cost the government around 4.5% of GDP, and the burden is growing. Some tariffs would need to triple or even be multiplied by seven times to reach market prices. With just a small correction, companies like PAM will perform better. A presidential election is coming in Argentina as of October 25, and the main contenders (Daniel Scioli, Mauricio Macri and Sergio Massa) have expressed its understanding about the need to lift some tariffs caps, in order to reduce the fiscal deficit, which is unsustainable at these levels. As the company’s aren’t capable of fulfilling the investment needs in electricity of the country, and several blackouts occur during the last quarters, the actual government is taking some measures to improve the situation. Two relevant facts take place during 2Q15 for Pampa Energía: 1) “SE Resolution No. 482/15: Increase in the Electricity Generation Remuneration Scheme On June 10, 2015, the Secretariat of Energy issued SE Resolution No. 482/15, in which it updates retroactively the remuneration for electricity generation as of February 2015 commercial transactions.” 2) “Gas Transportation Tariff Increase for Transportadora de Gas del Sur S.A. On June 8, 2015, the National Gas Regulatory Authority -ENARGAS- issued Resolution No. 3,347/15, which grants TGS a tariff increase for gas transportation and operation and maintenance fees of 44.3% and 73.1%, respectively, both retroactive to May 2015.” Source: Pampa Energía 2Q15. This and other measures have improved Pampa´s EBITDA and Profits. In the 2H15 : Consolidated sales revenues of AR$3,457.6 million ($378 million) for the six-month period ended on June 30, 2015, 18.4% higher than the AR$2,921.4 million ($319 million) for the same period of 2014. Adjusted consolidated EBITDA of AR$1,693.3 million ($185 million) for the six-month period ended on June 30, 2015, compared to AR$27.1 million ($9 million) for the same period of 2014. Consolidated profit of AR$1,365.1 million ($149 million) during the six-month period ended on June 30, 2015, of which a profit of AR$963.0 million ($105 million) is attributable to the owners of the company, compared to an AR$80.4 million loss (-$8.8 million) attributable to the owners of the company in the same period of 2014. With a market cap of $900 million, earnings per ADR in the 1H15 of $1.7, and foreseeable earnings of nearly $180 million a year, the forward P/E looks compelling. Just thinking about the replacement cost of its fixed assets, it´s easy to see how PAM is undervalued, and this is mostly caused by a regulatory environment which could improve soon. As a change in the government is approaching, it could be expected that some distortions will disappear, I´m not talking here about free market prices, as it´s “politically incorrect” to raise tariffs by 200% in a single move, but given the current situation, where PAM is trading at a forward P/E of 5, and making money under this difficult scenario, any improvement will boost earnings and improve the company´s situation. Risks: Currency risks are present since it’s widely expected that the new government will depreciate the local currency, but that depreciation will certainly include better tariffs for the utilities as the energy price is partly dollar linked as well as the importations of energy. Political risks are another factor to bear in mind, but as the current government deficit is unsustainable, some adjustments are needed. To conclude PAM is under the current conditions deeply undervalued, and that could increase if the pending integral tariff revision comes in place. If the Argentinean economy is going to improve, massive capex in the electricity sector would be needed, and PAM is in the better position to profit from that. Disclosure: I/we have no positions in any stocks mentioned, but may initiate a long position in PAM over the next 72 hours. (More…) I wrote this article myself, and it expresses my own opinions. I am not receiving compensation for it (other than from Seeking Alpha). I have no business relationship with any company whose stock is mentioned in this article.
Today’s Strong Competitive Wealth-Builder ETF Investment: IYG

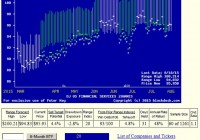
Summary From a population of some 350 actively-traded, substantial, and growing ETFs this is a currently attractive addition to a portfolio whose principal objective is wealth accumulation by active investing. We daily evaluate future near-term price gain prospects for quality, market-seasoned ETFs, based on the expectations of market-makers [MMs], drawing on their insights from client order-flows. The analysis of our subject ETF’s price prospects is reinforced by parallel MM forecasts for each of the ETF’s ten largest holdings. Qualitative appraisals of the forecasts are derived from how well the MMs have foreseen subsequent price behaviors following prior forecasts similar to today’s. Size of prospective gains, odds of winning transactions, worst-case price drawdowns, and marketability measures are all taken into account. Today’s most attractive ETF Is the iShares US Financial Services ETF (NYSEARCA: IYG ) . The investment seeks to track the investment results of an index composed of U.S. equities in the financial services sector. The fund generally invests at least 90% of its assets in securities of the underlying index and in depositary receipts representing securities of the underlying index. It seeks to track the investment results of the Dow Jones U.S. Financial Services Index (the “underlying index”), which measures the performance of the financial services sector of the U.S. equity market. It is a subset of the Dow Jones U.S. Financials Index. The fund is non-diversified. (from Yahoo.Finance.ETF.Profile) The fund currently holds assets of $774 million and has had a YTD price return of +5.49%. Its average daily trading volume of 107,208 produces a complete asset turnover calculation in 75 days at its current price of $95.95. Behavioral analysis of market-maker hedging actions while providing market liquidity for volume block trades in the ETF by interested major investment funds has produced the recent past (6 month) daily history of implied price range forecasts pictured in Figure 1. Figure 1 (used with permission) The vertical lines of Figure 1 are a visual history of forward-looking expectations of coming prices for the subject ETF. They are NOT a backward-in-time look at actual daily price ranges, but the heavy dot in each range is the ending market quote of the day the forecast was made. What is important in the picture is the balance of upside prospects in comparison to downside concerns. That ratio is expressed in the Range Index [RI], whose number tells what percentage of the whole range lies below the then current price. Today’s Range Index is used to evaluate how well prior forecasts of similar RIs for this ETF have previously worked out. The size of that historic sample is given near the right-hand end of the data line below the picture. The current RI’s size in relation to all available RIs of the past 5 years is indicated in the small blue thumbnail distribution at the bottom of Figure 1. The first items in the data line are current information: The current high and low of the forecast range, and the percent change from the market quote to the top of the range, as a sell target. The Range Index is of the current forecast. Other items of data are all derived from the history of prior forecasts. They stem from applying a T ime- E fficient R isk M anagement D iscipline to hypothetical holdings initiated by the MM forecasts. That discipline requires a next-day closing price cost position be held no longer than 63 market days (3 months) unless first encountered by a market close equal to or above the sell target. The net payoffs are the cumulative average simple percent gains of all such forecast positions, including losses. Days held are average market rather than calendar days held in the sample positions. Drawdown exposure indicates the typical worst-case price experience during those holding periods. Win odds tells what percentage proportion of the sample recovered from the drawdowns to produce a gain. The cred(ibility) ratio compares the sell target prospect with the historic net payoff experiences. Figure 2 provides a longer-time perspective by drawing a once-a week look from the Figure 1 source forecasts, back over two years. Figure 2 (used with permission) What does this ETF hold, causing such price expectations? Figure 3 is a list of securities held by the subject ETF, indicating its concentration in the top ten largest holdings, and their percentage of the ETF’s total value. Figure 3 Source: Yahoo Finance IYG Concentrates 60% of its assets in its top ten commitments. This provides a responsive measure of the action of market prices of stocks in this essential sector. The major holdings are all established, dominant participants in the financial services industry. Figure 4 is a table of data lines similar to that contained in Figure 1, for each of the top ten holdings of IYG. For convenience, the IYG data itself is included. Figure 4 (click to enlarge) Column (5) contains the upside price change forecasts between current market prices (4) and the upper limit of prices (2), regarded by MMs as being worth paying for protection from adverse price change. The average of +7.2% of the top ten IYG holdings is well above the market-average proxy of SPY of +5.3%. Diversification of IYG’s other 40% of holdings damps its overall upside (as MMs see it) to only +4.4%. But in the same stroke the risk side of the equation in (6) for IYG is brought down to worst-case price drawdowns of -2.8%, below the defensive market-tracking ETF SPY norm of -3.2%. In an environment many consider imbued with high market risk, IYG may provide a very attractive balance. The ability of IYG holdings to recover from those worst-case drawdowns and achieve profits (8) occurred in 93% of experiences. The equity population only recovered less than two thirds of the time, and while the SPY experiences were more consistent, the achieved gains were much smaller. SPY has had only +3.5% gains previously from like forecasts of +5.3%. Another qualitative consideration is the credibility of IYG after previous forecasts like today’s. Its net average price change gain (column 9) has been 1.1 times the size of the upside forecast average, +4.8% compared to +4.4%. The equity population’s actual price gain achievement, net of losses has been a pitiful +3.2% compared to promises of 13.5%. Conclusion IYG provides attractive forecast price gains, supported by its equally appealing largest holdings. Both the ETF and many of its major holdings offer very attractive prospects in near-term price behaviors, demonstrated by previous experiences following prior similar forecasts by market makers. But it may be considered a defensive commitment in the face of widespread anticipation of further market weakness. A more constructive strategy would be to seek out individual stock opportunities offering odds-on achievement of low double-digit price gains where past similar forecasts encountered only small worst-case price drawdowns during their relatively short holding periods en route to sell targets. The blue summary row of Figure 3 labeled “20 best odds forecasts” tells what the current top-ranked wealth-building opportunities are offering, as a comparative competitive norm. YTD in 2015, 2062 of these 20-a-day list members have reached closeouts in an average of 2-month holding periods, providing a +30% annual rate of average price-change gains. Disclosure: I/we have no positions in any stocks mentioned, and no plans to initiate any positions within the next 72 hours. (More…) I wrote this article myself, and it expresses my own opinions. I am not receiving compensation for it (other than from Seeking Alpha). I have no business relationship with any company whose stock is mentioned in this article.

Has Monthly Resetting Helped Or Hurt The ETRACS 2x Leveraged ETNs?

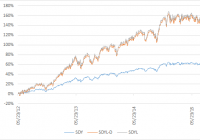
Summary The UBS ETRACS line-up of ETNs includes a number of 2x leveraged funds. The use of leverage allows the ETNs to offer higher yields, but may also increase their propensity for decay or slippage during volatile periods. The ETRACS ETNs reset their leverage monthly, has this helped or hurt their performance? Introduction The UBS (NYSE: UBS ) ETRACS line-up of ETNs cover a broad range of investment classes, including traditional equity as well as alternative investment types such as real estate investment trusts [REITs], mortgage REITs [mREITs], master limited partnerships [MLPs], business development companies [BDCs] and closed-end funds [CEFs]. A number of the ETRACS ETNs are 2x leveraged, which means that they seek to return two times the total return of the underlying index, minus fees. This allows the ETNs to offer sometimes mouth-wateringly high headline yields, making them attractive for income investors. Moreover, some of these funds offer monthly (albeit sometimes lumpy) distributions. A recent article provides an overview of the types, yields and expense ratios of these 2x leveraged ETNs. An interesting feature of the 2X leveraged ETNs is that their leverage resets monthly rather than daily, which is the norm for most leveraged funds in the market. It is well known that decay or slippage in leveraged funds will occur when the underlying index is volatile with no net change over a period of time. This “beta-slippage” has been addressed by Seeking Alpha author Fred Picard in an article entitled ” What You Need To Know About The Decay Of Leveraged ETFs “. However, by resetting monthly rather than daily, the decay of the ETRACS ETNs might be somewhat mitigated. Seeking Alpha author Dane Van Domelen has also conducted both theoretical and empirical research into the performance of leveraged funds. His research showed that in most cases, the decay is not as serious as is often initially thought to be. A subsequent article using data from 1980 to 2015 showed that monthly resetting was superior to daily resetting for a 2x leveraged version of S&P 500. This article seeks to directly address the monthly vs. daily resetting issue for a number of the ETRACS 2x leveraged ETNs. Has monthly resetting helped or hurt the ETNs compared to the equivalent daily resetting fund? Methodology The five ETNs chosen for this analysis are shown in the table below, together with their yields, inception date, volume, total expense ratio and corresponding 1x leveraged fund. For details for how the total expense ratio is calculated, please see my previous articles ( I , II ). Fund Ticker Yield Inception Volume TER* 1X Alternative Monthly Pay 2xLeveraged S&P Dividend ETN (NYSEARCA: SDYL ) 5.43% 5/2012 1.8K 1.01% SPDR Dividend ETF (NYSEARCA: SDY ) 2xMonthly Leveraged Long Alerian MLP Infrastructure Index ETN (NYSEARCA: MLPL ) 15.02% 7/2010 103K 1.16% Alerian MLP Infrastructure Index ETN (NYSEARCA: MLPI ) 2xLeveraged Long Wells Fargo Business Development Company Index ETN (NYSEARCA: BDCL ) 20.24% 5/2011 164K 1.16% Wells Fargo Business Development Company ETN (NYSEARCA: BDCS ) Monthly Pay 2xLeveraged Mortgage REIT ETN (NYSEARCA: MORL ) 26.52% 10/2012 289K 1.11% Market Vectors Mortgage REIT Income ETF (NYSEARCA: MORT ) Monthly Pay 2xLeveraged Closed-End Fund ETN (NYSEARCA: CEFL ) 22.04% 12/2013 150K 1.21% YieldShares High Income ETF (NYSEARCA: YYY ) * Includes 3-month LIBOR (currently 0.31%). Those five funds were chosen because they represent some of the more popular ETRACS ETNs, and also because they have existed for sufficient duration to be analyzed. The historical data for both the 2x and 1x leveraged funds were downloaded from Yahoo Finance . Using data for the 1x leveraged fund, I then reconstructed the price history for a hypothetically 2x leveraged fund that resets daily instead of monthly. The normalized price history for the three funds, i.e. the 1x leveraged fund, the (hypothetical) daily-reset 2x leveraged fund and the (actual) monthly-reset 2x leveraged fund are then plotted on the same graph, as shown below. SDYL The first example shown is SDYL, 2x high-dividend equity fund. Since inception in May 2012, the corresponding 1x fund SDY has returned 63.6%, while the 2x SDYL has returned 161.0%, which is over twice that of the 1x fund (the actual number is 2.53 times). This illustrates the powerful compounding of leverage that takes place when the underlying asset moves strongly in one direction with little volatility. Additionally, we observe that the hypothetical daily-resetting SDYL (SDYL-D) has a very similar price history to the actual, monthly-resetting SDYL. SDYL-D ended up with a total return of 157.4%, which is just a few percentage points lower than that of SDYL. MLPL MLPL is a 2x fund of midstream MLP companies. Since inception in Jul. 2010, the 1x fund MLPI has returned 61.0%. The 2x MLPL has returned 141.9%, while the hypothetical MLPL-D returned 125.2%. Studying the price history of these three funds is instructive. We can see that the strong bull market in MLPs from inception to Jul. 2014 provided roaring returns for both MLPL and MLPL-D. While the 1x MLPI increased by ca. 100% over this time period, and MLPL and MLPL-D returned over 300%, a quadrupling of value. This further reinforces the notion that leverage works in your favor when an asset is in a rising trend (of course, the opposite is just as true). Moreover, MLPL and MLPL-D tracked each other closely during the MLP bull market, the first four years of this chart. Then why did MLPD-D return some 15% less than MLPL since inception? The answer lies in the fifth and final year of this chart, a period of extremely volatility in oil and oil-related stocks. During this period, we see divergence between the two 2x funds, with the monthly-resetting MLPL falling less than the daily-resetting MLPL-D during this time. This seems to support the conventional wisdom that monthly-resetting is superior to daily-resetting during bouts of heightened volatility. BDCL BDCL is a 2x fund of BDCs. BDCL’s inception took place at an unfortunate time, in the midst of the Eurozone debt crisis. BDCL dropped over 40% from its inception in May 2011 before rebounding. Since inception, the 1x BDCS returned 24.6% and the 2x BDCL returned 45.1%, which is slightly less than twice that of the 1x fund. This illustrates the negative effect that leverage has when the underlying asset moves strongly in one direction, and then reverses. To further highlight this, consider the fact that when BDCS (blue line in chart) breaks even in early 2012, BDCL is still approximately 10% below its inception price. While BDCL fared less well than expected, the daily-resetting BDCL-D did even worse. It returned only 31.3% since inception, significantly underperforming BDCL at 45.1%. This further reinforces the notion that monthly-resetting is advantageous when the underlying asset is volatile. MORL MORL owns a 2x leveraged basket of mREITs. Since inception in Oct. 2012, the 1x MORT has returned 13.0% while the 2x MORL has returned 16.7%, which is far lower than twice of the 1x fund. This indicates that like BDCL, MORL has performed worse than expected. As can be seen from the above chart, this can be attributed to the large price swings experienced by the underlying asset, causing leverage to work against the 2x funds. Very surprisingly, however, the hypothetical daily-reset MORL-D (20.10%) actually outperformed MORL. This contradicts the earlier notion that daily resetting is inferior to monthly resetting during volatile periods. The reason for this result is currently unclear to me. CEFL The final fund to be analyzed is CEFL, a fund-of-CEFs. Since inception in Dec. 2013, the 1x YYY has returned -4.5% while the 2x CEFL has returned approximately twice that, at -9.1%. Interestingly, and unlike MORL, the price swings in CEFL did not appear to adversely affect its total return performance. However, this could also be due to CEFL’s shorter history compared to MORL. The hypothetical daily-reset CEFL-D performed only slightly worse than CEFL, at -9.9%. However, this difference is too small for any meaningful conclusions to be drawn for this fund. Conclusion In his article , Dane Van Domelen wrote: In theory, it’s hard to say whether a 2x daily or 2x monthly leveraged ETF should perform better. During steady index growth or decline, daily is better; during volatile periods for the index with little or no net change, monthly is better. The results of this study partially agree with Dane’s conclusion, but also suggest that the real situation, empirically at least, may be a bit more complicated. Analysis of these five 2x monthly-reset ETNs and their hypothetical daily-reset counterparts revealed that: There was no significant difference in performance between monthly and daily resets when the asset was in a steady upward trend, as was the case for SDYL and the first four years of MLPL. MLPL outperformed the daily-reset MLPL-D during the most recent 1-year period, in which the asset tumbled and with high volatility. For the more volatile ETNs, namely BDCL, MORL, and CEFL, the results were mixed. BDCL significantly outperformed BDCL-D over four years, while MORL underperformed MORL-D over three years. CEFL and CEFL-D had comparable results over two years. Overall, four out of five of the monthly-reset ETNs outperformed their daily-reset counterparts, although the differences were often small: SDYL (161.0% vs. 157.4% for SDYL-D), MLPL (141.9% vs. 125.2%), BDCL (45.1% vs. 31.3%) and CEFL (-9.1% vs. -9.9%). The only underperforming monthly-reset ETN was MORL (16.7% vs. 20.1%). The average differential for the 5 ETNs was +6.3%. In summary, with regards to the question posed in the title, “Has Monthly Resetting Helped Or Hurt The ETRACS 2x Leveraged ETNs?”, I would have to say that the jury is still out. I am slightly leaning towards the “helped” side however. This article used mainly empirical and reconstructed data, so I am also interested to hear if any of the more mathematically-inclined investors would be able to provide a more theoretical framework for the monthly vs. daily resetting issue. Disclosure: I/we have no positions in any stocks mentioned, and no plans to initiate any positions within the next 72 hours. (More…) I wrote this article myself, and it expresses my own opinions. I am not receiving compensation for it (other than from Seeking Alpha). I have no business relationship with any company whose stock is mentioned in this article.