Tag Archives: undefined

RevenueShares Ultra Dividend Has Utility

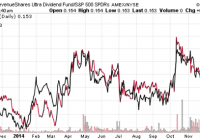
Summary RDIV has a relatively high yield compared to its nearest competitors such as DVY. RDIV takes the S&P 500 Index, pulls out the top 60 highest yielding stocks, and then weights them by revenues. RDIV’s strategy in the current market environment results in a very utilities heavy portfolio. RevenueShares takes a different approach to indexing. Instead of using the market capitalization approach to weighting index constituents, the firm uses a company’s share of revenues. RevenueShares takes an existing S&P index such as the S&P 500 Index and then applies the different weighting methodology. One of the main arguments against market capitalization weighted indexes is the valuation argument. As the price of a stock rises, so does its market cap, and over time a market cap weighted index becomes increasingly weighted towards overvalued shares. By using revenues as a weighting strategy, as a stock price rises faster than its revenue share, it is sold off at rebalancings. If a company’s stock price falls, but its revenues are steady or rise as a share of the index, it is purchased at each rebalancing. In other words, stocks that are overvalued by the price-to-sales metric are sold, and stocks that are undervalued by the price-to-sales ratio are purchased. RevenueShares has a dividend fund that uses this strategy: the RevenueShares Ultra Dividend ETF (NYSEARCA: RDIV ) . Index & Strategy As mentioned, RDIV weights the index by revenues. The index constituent universe is the S&P 500 Index. The field is narrowed to the top 60 stocks, ranked by the average 12-month trailing dividend yield. Holdings are then weighted by revenue. The result is a portfolio heavily overweight the top holdings in the modified index, as well as overweight the “defensive” sectors. The top 10 holdings are book-ended by Duke Energy (NYSE: DUK ) at the top, with a 5.07 percent weight as of January 26, and Kinder Morgan (NYSE: KMI ) at the bottom with 4.20 percent of assets. The top 10 holdings combine for 46.70 percent of assets. Utilities dominate sector exposure, with 39 percent of assets. The telecom sector is also overweight relative to the S&P 500 Index, at 17 percent of assets. Consumer staples and energy make up 16 percent and 13 percent of assets, respectively. Technology is almost non-existent at 0.19 percent of assets. Financials are very underweight relative to the S&P 500 at 4 percent of assets, and there’s no healthcare exposure. This makes for a very “defensive” portfolio whose performance currently lives and dies by the utilities sector. Performance RDIV’s inception date is October 2013. For much of this period, the utilities sector has performed very well and it was the best performing S&P 500 sector in 2014. The first chart here is the price ratio of RDIV versus the SPDR S&P 500 Trust ETF (NYSEARCA: SPY ) in red. In black, for comparison, is the price ratio of the Utilities Select Sector SPDR ETF (NYSEARCA: XLU ) versus SPY. The chart confirms what the sector exposure tells us: RDIV is highly influenced by the utilities sector. (click to enlarge) A dividend ETF with a similarly high concentration in utilities is the iShares Select Dividend ETF (NYSEARCA: DVY ), and the two funds fall into nearly the same section of Morningstar’s Stylebox: Large Cap Value. DVY falls on the line with the mid cap box and gets a Mid-Cap Value classification from Morningstar. The chart below shows the price ratio of RDIV to DVY, plus the price of the Industrial Select Sector SPDR ETF (NYSEARCA: XLI ). Industrials is the second largest sector in DVY. When industrials have rallied, RDIV trailed DVY, and vice versa. (click to enlarge) Finally, here’s a performance chart of RDIV, DVY, SDY and SPY since the inception of RDIV, showing that despite having different sector exposure, they’ve largely traded together. RDIV comes out on top thanks to it large utilities exposure. (click to enlarge) Expenses RDIV charges 0.49 percent. This is higher than DVY’s 0.39 percent and SDY’s 0.35 percent expense ratio. Income RDIV has a trailing 12-month yield of 3.26 percent. With only five quarters of dividend payments, it’s too early to evaluate the fund’s payout growth rate. The yield exceeds DVY’s 12-month trailing yield of 3.03 percent. Conclusion RDIV is a new fund that hasn’t found a large following yet, amassing only $52 million in assets in its first 15 months. The heavy weighting of the utility sector is an issue, but DVY has attracted nearly $16 billion in assets with nearly as much in the sector. Overall, the revenue weighting strategy shows a good track record and the yield on RDIV is competitive with the competition. Sector exposure won’t always lean in favor of utilities this much, but for the foreseeable future that’s likely to still be the case. Investors comfortable with that level of exposure can consider the fund as part of a dividend strategy. The main risk for the fund is the same for the utilities sector and dividend funds more generally. If interest rates stay low, investors will eventually bid up RDIV’s holdings until the yield gap with other dividend ETFs closes. If interest rates increase, the high debt utilities sector will come under pressure and investors will look beyond dividend shares to other income alternatives. Rates have come down substantially over the past couple of months though, so a major rebound will be required to take rates back to a level where they are competitive with stocks. The 30-year treasury yield was 2.40 percent as of January 26, down from 3.1 percent in November.

Dominion Resources Set To Grow At Better Pace Than Its Peers

Summary Ongoing efforts to extend and improve operations will grow future top and bottom-line numbers. Company’s healthy earnings growth prospects will support cash flow base. D offers cheaper growth as compared to peers. Dominion Resources (NYSE: D ), one of the largest U.S. utility companies, has extended operations across the Mid-Atlantic region. D’s diversified electric and natural gas operations have been getting better revenue and earnings growth. As the company is increasing its growth capital expenditures to grow both electric and natural gas businesses, D’s long-term earnings growth outlook looks stable and attractive. And in fact, significant growth potential as a result of capital expenditures makes me believe the company will continue to grow its dividends at a healthy pace in the long term. The company’s earnings are expected to grow at an average rate of 6% in the next five years. Along with healthy growth prospects, the stock offers an attractive dividend yield of approximately 3%, which makes it an attractive pick for dividend-seeking investors. Elevated Growth Capital expenditure will guard D’s Long-Term Growth The U.S. utility sector has performed pretty well in 2014. And in the wake of improving economic conditions, future growth prospects of the industry also look bright. As far as D is concerned, with ongoing increases in its growth capital expenditures directed towards betterment and extension of its infrastructure and operations, the company has been strengthening its position among other utility sector giants. And in this regard, D has recently increased its long-term capital expenditure outlook from 2014-2019; the company will now spend $20.4 billion (guidance mid-point), higher than the previous forecast of $14 billion , on its various energy infrastructure projects. The value of these growth investments lies in strengthening the company’s current energy infrastructure in order to serve its customer base in a more competent and effective way. The following chart shows updated figures for the company’s increased capital expenditure on various growth projects. (click to enlarge) Source: Investor’s Meeting Presentation As natural gas production has significantly increased in the U.S., D is directing the major chunk of its capital expenditure to improve its natural gas infrastructure. As a matter of fact, one of the most important growth projects of the company is the Atlantic Coast Pipeline (NYSE: ACP ) project, which is a joint venture of D, Duke Energy (NYSE: DUK ), Piedmont Natural Gas Company (NYSE: PNY ) and AGL Resources Inc. (NYSE: GAS ). The ACP project’s pipelines, which have a capacity of 1.5Bcf/day, expandable to 2Bcf/Day, are waiting for FERC approval. The project’s construction is expected to begin in mid-2016, after which it will be made available for commercial operations by the end of 2018. D has the largest stake of 45% in the project, and I believe the company will benefit from this $5 billion project in the long run by meeting the increased natural gas transmission demand in Virginia and in North Carolina. Also, the company has invested $500 million towards its 1.0-1.5Bcf/day Supply Header Project (NYSE: SHP ). The timing to start SHP operations has been perfectly linked to the ACP project in order to support ACP by connecting its pipelines with five supply header reception points. With their operations scheduled to start in 2018, ACP and SHP will deliver natural gas to Virginia and North Carolina. In fact, these projects will allow D to increase its rates, which will portend well for its top and bottom-line growths in the long term. In addition to the ACP and SHP projects, the company has also agreed to acquire CGT for its subsidiary Dominion Midstream Partners, LP (NYSE: DM ). The addition of CGT offers an appealing opportunity to DM to raise rates in Virginia and Carolina, which will portend well to improve the company’s overall earnings base in the years ahead. Furthermore, the company is actively working to capitalize on the growth potentials of its Cove Point LNG export project, which has a capacity of 5.25 million tons/year . The Cove Point terminal facility is the first LNG export facility outside Louisiana and Texas to get government permission to export LNG. And it has created D’s monopoly, which will allow the company to enhance its bargaining power with suppliers. The company has already signed a 20-year LNG supply contract with Japan’s Sumitomo Corporation and Gail India. Owing to the longevity of these contracts, I believe D will have secure and strong top and bottom line bases for the years ahead. In addition to the abovementioned projects, the company is also making investments in renewable energy projects to strengthen its energy portfolio and comply with environmental regulations. In this regard, D has acquired the 28.4MW West Antelope Solar Park and the 50MW Pavant Solar Project . In its attempts to further capitalize on the growth prospects of renewable energy projects, the company has recently filed a request with VSCC to construct the first and largest solar facility in Virginia. By facilitating its customers to purchase electricity from its 2MW solar energy facility in Virginia, the company has created another important revenue generating source. Due to the impressive capital expenditure outlook and healthy growth prospects of the ongoing projects, I believe D is well-headed to delivering EPS growth in high-single digits. The company is scheduled for the 4Q’14 earnings call early next month, and during the earnings call, D will update its capital expenditure outlook and provide 2015 earnings guidance; any increase in capital expenditure outlook will portend well for its future growth and stock price. Hefty Dividends D’s healthy growth prospects have been fueling its earnings and cash flow growth, and helping it make attractive dividend payments to shareholders. Owing to its strong track record of making hefty dividend payments, the company is currently offering an attractive dividend yield of 3% . Since D is aggressively pursuing growth opportunities by making capital expenditures, I believe the company will attain more cash flow stability in the years ahead. Also, the company will continue to grow its dividends at a healthy pace in the years ahead; in the last five years, the company increased its dividends at an average rate of 7.3% . Risks The company’s efforts to expand its business operations, if not handled and executed effectively, could result in mismanagement and could weigh on its future performance. Moreover, regulatory restrictions and unfavorable movements in commodity prices are key risks to its future stock price performance. Conclusion The company’s ongoing efforts to extend and improve its operations are well-headed to grow its future top and bottom-line numbers. Moreover, the company’s healthy earnings growth prospects will support its cash flow base, which will allow it to consistently grow its dividends. The company currently has a higher forward P/E of 21.15x , as compared to Duke Energy’s and Southern’s forward P/E of 18.60x and 18.20x , respectively. I believe the higher forward P/E of D is justified due to its better growth prospects, as shown below in the table. Also, the company offers cheaper growth as compared to its peers, as it has a lower PEG of 2.9 , as compared to DUK’s PEG of 3.5 and SO’s PEG of 4.5 . The following table shows that D’s future earnings growth rate remains better than its peers. 2015 2016 2017 Long-Term 5-Year D 8.77% 4.80% 6.11% 6.05% DUK 3.97% 4.34% 5.27% 4.76% SO 2.13% 3.66% 4.31% 3.63% Source: Nasdaq.com

VNQ: A REIT ETF Worthy Of My Portfolio

Summary VNQ offers investors the full package of benefits I’m looking for. The ETF is offering excellent correlation benefits to SPY, low expense ratios, and great liquidity. REIT ETF’s generally offer very strong dividend yields. I’m not seeing any reason not to use VNQ. Investors should be seeking to improve their risk adjusted returns. I’m a big fan of using ETFs to achieve the risk adjusted returns relative to the portfolios that a normal investor can generate for themselves after trading costs. I’m working on building a new portfolio and I’m going to be analyzing several of the ETFs that I am considering for my personal portfolio. One of the funds that I’m considering is the Vanguard REIT Index Fund ETF (NYSEARCA: VNQ ). I’ll be performing a substantial portion of my analysis along the lines of modern portfolio theory, so my goal is to find ways to minimize costs while achieving diversification to reduce my risk level. What does VNQ do? VNQ attempts to track the total return (before fees and expenses) of the MSCI U.S. REIT Index. Substantially all of the assets are invested in funds included in this index. VNQ falls under the category of “Real Estate”. Does VNQ provide diversification benefits to a portfolio? Each investor may hold a different portfolio, but I use the SPDR S&P 500 Trust ETF (NYSEARCA: SPY ) as the basis for my analysis. I believe SPY, or another large cap U.S. fund with similar properties, represents the reasonable first step for many investors designing an ETF portfolio. Therefore, I start my diversification analysis by seeing how it works with SPY. I start with an ANOVA table: (click to enlarge) The correlation is just under 66%. That’s a very solid level of correlation and not unusual for comparing a REIT index to SPY. As an investor using modern portfolio theory, I’m happy with seeing that level of correlation. Of course, the value low correlation wouldn’t mean much if the values were being distorted by poor liquidity. The average volume of nearly 5 million shares per day suggests that liquidity shouldn’t be a concern. That’s a good sign for investors wanting verification of the statistics or wanting to know that they can exit the position with less concern about it deviating from NAV. Standard deviation of daily returns (dividend adjusted, measured since November 2013) The standard deviation is fairly reasonable. For VNQ it is .843%. For SPY, it is 0.736% for the same period. The ETF is definitely showing more volatility than SPY by a noticeable margin when we compare returns on a daily basis. Given the low correlation, it should still improve the risk profile of the portfolio. Mixing it with SPY I run comparisons on the standard deviation of daily returns for the portfolio assuming that the portfolio is combined with the S&P 500. For research, I assume daily rebalancing because it dramatically simplifies the math. With a 50/50 weighting in a portfolio holding only SPY and VNQ, the standard deviation of daily returns across the entire portfolio is 0.719%. With 80% in SPY and 20% in VNQ, the standard deviation of the portfolio would have been .711%. If an investor wanted to use VNQ as a supplement to their portfolio, the standard deviation across the portfolio with 95% in SPY and 5% in VNQ would have been .727%. In each scenario, the overall portfolio has less volatility than SPY. I am leaning towards running REITs in my portfolio as 10 to 20% of the total portfolio. Why I use standard deviation of daily returns I don’t believe historical returns have predictive power for future returns, but I do believe historical values for standard deviations of returns relative to other ETFs have some predictive power on future risks and correlations. Yield & Taxes The distribution yield is 3.60%. I like to see strong yields for retiring portfolios because I don’t want to touch the principal. By investing in ETFs I’m removing some of the human emotions, such as panic. Higher yields imply lower growth rates (without reinvestment) over the long term, but that is an acceptable trade off in my opinion. The ETF is composed of REITs, so investors concerned about the taxation impacts of investing in a REIT ETF should seek tax advice from a qualified professional. Expense Ratio The ETF is posting an expense ratio of .10%. I want diversification, I want stability, and I don’t want to pay for them. An expense ratio of .10% is absolutely beautiful and extremely attractive for an ETF that is also offering low correlation to SPY, strong yields, and great liquidity. Market to NAV The ETF is at a .05% discount to NAV currently. Premiums or discounts to NAV can change very quickly so investors should check prior to putting in an order. Generally speaking, that discount to NAV isn’t big enough to be a big deal. However, even a small discount to NAV is fairly attractive when we are talking about a high quality ETF. In my opinion, this is easily one of the most attractive ETFs I have examined. Largest Holdings The diversification in the holdings isn’t going to be a strong selling point. Nothing against Simon Property Group (NYSE: SPG ), but over 8% in the position is pretty big. Given that the expense ratio is .10%, I think that offsets the relatively mediocre level of diversification within the positions. The other individual companies that are making up the top several sections all have different exposures, such as self-storage, multi-family housing, and health care. (click to enlarge) Conclusion The combination of correlation, liquidity, and yield makes a great investment for investors that want to reduce the overall volatility of their portfolio without having their capital tied up in investments that can be difficult to exit. For investors looking at the very long term picture, the extremely low expense ratio is beautiful. Vanguard and Schwab have provided some ETFs with very low expense ratios. I don’t think an ETF should be chosen purely for the expense ratio, but I do believe investors should be very aware of it. When I’m putting together hypothetical portfolio positions, one of the things I include is the expense ratio of the ETFs to track the overall expense ratio on the portfolio. In trying to find anything wrong with the ETF, the biggest weaknesses would probably be the size of the position in SPG and the fact that it is market weighted. However, most ETFs are market weighted. Most ETFs also have enough weaknesses that I can easily spot at least something wrong. In the case of VNQ, the market cap issue is offset by the fund having a turnover ratio of only 11%. I’ve had a preference for Schwab funds because I have an account that can trade them for free. However, I also have some significant tax exempt accounts with other brokerages. I’m strongly considering VNQ for a position in my IRA. Got a different opinion? An argument for why I shouldn’t invest in VNQ? Let’s hear it in the comments. Additional disclosure: Information in this article represents the opinion of the analyst. All statements are represented as opinions, rather than facts, and should not be construed as advice to buy or sell a security. Ratings of “outperform” and “underperform” reflect the analyst’s estimation of a divergence between the market value for a security and the price that would be appropriate given the potential for risks and returns relative to other securities. The analyst does not know your particular objectives for returns or constraints upon investing. All investors are encouraged to do their own research before making any investment decision. Information is regularly obtained from Yahoo Finance, Google Finance, and SEC Database. If Yahoo, Google, or the SEC database contained faulty or old information it could be incorporated into my analysis. The analyst holds a diversified portfolio including mutual funds or index funds which may include a small long exposure to the stock.