U.S. Regulated Utilities Sector Is Fairly Valued At Current Levels
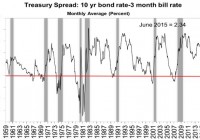
Summary Weakness in natural gas/power prices to continue for the next 3-4 years. On-going coal retirement plan to have a negligible impact on natural gas prices. Stringent environmental policies may lead to structural changes in the utilities sector. Consolidation of utilities sector continues for the next 2-3 years. In 2014, utilities sector was one of the best performing sectors in the S&P 500 but much of that outperformance has eroded since the beginning of 2015. Key economic indicators such as job market, inflation and Fed rate increase have put significant pressure on utilities stocks. I expect utilities sector as a whole to underperform and investors need to be choosy in the sector before investing. Weakness in natural gas/power prices to continue for the next 3-4 years The weakness in natural gas prices is expected to continue for the next 3-4 years given oversupply, continued operations of cash strapped nuclear plants and on-going coal retirement plans. The natural gas production in South West and North East Marcellus has increased significantly. PJM forward gas prices trade at a discount to Henry Hub as the production especially in Marcellus has already outpaced the capacity reduction. Lack of pipeline infrastructure projects from the companies and strong production growth should maintain the current trend for the next 3-4 years. Recently EIA has also increased the natural gas production outlook for 2015 and 2016 by around 1bcf/day. I believe the on-going coal retirement plan impacts the natural gas prices slightly and not enough to impact forward prices. On the downward side, higher penetration of renewable energy resource will offset any increase in demand for gas due to coal retirement. US Federal has also asked certain cash-strapped nuclear power plants to continue running for some more time (earlier intended to shut down for economic reasons) that would create downward pressure on natural gas prices. Most of the utilities hedge for the short term but in the long-term they will be under greater risk. I don’t see any decrease in gas prices from the current level going forward. The most impacted to forward gas prices are the base-load generators such as American Electric Power Company (NYSE: AEP ), Exelon Corporation (NYSE: EXC ) and Entergy Corporation (NYSE: ETR ) that use only coal and nuclear energy for power generation. These companies look less competitive in a low gas price trend. On the power prices, electric utilities industry is estimated to experience a weak or negative electric demand growth in the next 2-3 years. PJM West is currently oversupplied making the power prices different than in PJM East. I believe some supply from PJM West will be transferred to capacity-constrained PJM East and over a time the difference should dissipate. On-going coal retirement plan to have a negligible impact on natural gas prices Due to stringent environmental policies such as MATS and 111D of Clean Air Act power for CO2 emission reduction, utilities have been asked by the Federal Energy Regulatory Commission (FERC) to retire certain coal assets that are not economical and environment friendly. Around 60-70GW of coal capacity is expected to be retired in the next two years. I believe the bulk of retirement to happen from mid 2015 to 2016. As mentioned earlier, the impact of coal retirement on gas prices is very negligible given the high rate of gas production growth, continuous operations of nuclear plants and renewable penetration. As per Energy Information Administration (EIA) estimates, the contribution from coal energy to national power generation will go down to 30% from the current level of 45% once all the coal retirement is done (expected by 2019) and the contribution from natural gas will increase to 40% from the current level of 23%. Stringent environmental policies may lead to structural changes in the utilities sector 111D of the Clean Air Act: In 2014, Environmental Protection Agency (EPA) released proposed CO2 (Carbon) reduction targets that would reduce carbon emissions for existing coal plants (in utilities sector) around 19% in 2030 from 2012 levels (30% reduction from 2005 levels). While I expect a final rule from EPA by August 2015, it will require each state to submit a SIP (State Implementation Plan) by mid-year 2016 for compliance. Each state will be required to meet its specific targets starting in 2020 through 2030. MATS (Mercury and Air Toxics Standards) : MATS sets standards for Mercury and other air toxics generated by coal and oil plants that are larger than 25MW. Everyone will need to comply including investor-owned utilities and public power utilities. The objective of the Standard is to bring old power plants to new technology. With the current gas price environment, these plants are uneconomical to rejuvenate. As mentioned earlier, certain cash-strapped nuclear plants have been asked to continue running though they are not economical under the depressed natural gas prices. The main reason was to provide room for states to adhere to Clean Air Act. Allowing nuclear plants to shut down will make it more challenging for states to meet stringent requirements and create capacity constraints. Under depressed gas prices, nuclear plants look uneconomical Under depressed natural gas prices, running a nuclear power plant has become uneconomical for utilities. The quark spread (power price minus uranium cost) has consistently decreased over the past few years. However the US Federal asked utilities companies to keep running certain nuclear assets to make room for retiring coal assets. Under the policy, I believe few utilities benefit and few others loose in the short run. A clear beneficiary is base-load nuclear operator EXC and looser is base load coal operators like First Energy (NYSE: FE ). Consolidation of utilities sector continues for the next 2-3 years Under the weak economy, utilities are thirsty for growth. The industry has seen a lot of acquisitions recently (few are mentioned below). I expect the industry consolidation to continue for the next 2-3 years as there is going to structural changes in the industry due to new regulations. Acquirer Target Deal status Duke Energy Progressive Energy Completed NRG Energy GenOn Completed Teco Energy New Mexico Gas Completed Berkshire NV Energy Completed Fortis UNS Completed Exelon Pepco Pending Source: Google I believe the utilities mainly look for targets that are small/mid cap utilities, having exposure to renewable energy, under single state jurisdictions and having good regulatory construct. Future deals will be mainly towards acquiring growth, improving acquirer’s earnings profile etc. Over the last 2 years, multiples paid for acquiring utilities were in the range of 18x-24x. As the utilities are currently trading in the range of 13-15x forward earnings, they look very attractive for any takeover bid. On the other side, utilities are reducing exposure to non-core assets (merchant power generation assets). Given highly volatile commodities market, merchant power generation assets look unworthy for the investors. In order to improve multiples for the regulated assets, power companies have been forced to sell merchant assets. I believe generating assets in a bleak power cycle are worth more in a regulated environment than in pure-play independent power producer (IPP). In last 2 years, we have seen EXC, FE, PPL, DUK and NEE selling their merchant generation business. Who will be potential sellers now? FirstEnergy and American Electric Power are two potential sellers of their merchant assets. Both have publicly confirmed that an outright sale of their merchant generation is highly likely. Solar energy to support capacity reduction due to coal retirement Solar energy should continue to play an important role within the utilities industry. Most of the companies that declined to adapt to solar energy earlier have already started to spend on solar energy assets. Solar growth will remain healthy going forward as utilities: (1) see solar energy as highly economical, (2) look for fuel diversification, and (3) meet legislative mandates. With utilities retiring significant coal assets and nuclear viability continuing to face headwinds, the companies have been highly dependent on natural gas. As the natural gas is highly volatile federal level and state level regulators have been in significant pressure to look find alternative viable energy source. The time has come for utilities to diversify their generation assets (adding solar capacity) and reduce the volatility and any unexpected surge in gas prices. On the negative side, solar will slowly start gaining momentum and steal volumes from utilities at the peak time of the day when generators make the most margin. New capacity performance auction to reward utilities that adhere to auction rules PJM capacity market ensures long-term grid reliability by procuring the appropriate amount of power supply resources needed to meet predicted energy demand three years in the future. Increased outages during the 2013/2014 polar vortex triggered FERC to change capacity regulations (mainly in the upcoming auction regulations for 2018-2019 planning year) in order companies to strictly adhere to stipulated supply. In extreme weather conditions, power generators were impacted with mechanical issues and natural gas supply interruptions. PJM claims that the existing capacity bid offers set at the avoidable cost rate (ACR) are unable to secure reliable capacity. In order to secure reliable capacity, PJM has introduced a new capacity performance (NYSE: CP ) resource product with higher rewards and penalties. Upcoming capacity auction timeline PJM is holding two transitional auctions for 2016/2017 and 2017/2018 this summer. The first will take offers July 27 and 28 and results will be posted on the 30th Jule. The auction for 2017/2018 will take offers August 3 and 4 and results will be posted on August 6, 2015. Work for the 2018/2019 auction will start later this month, but it is being held from August 10-14 and the results will be announced on August 21, 2015. Regulated utilities look fairly priced There seems to be an inverse correlation between bond yields and forward P/E multiples of utilities companies. I expect the interest rates to start picking up from 2016 but not until the presidential elections. Regulated utilities I have valued regulated utilities based on 2016 P/E multiple. From the industry point of view, utilities look fairly valued. Given regulated utilities trading at 15.0x forward 2016 earnings (in line with their fundamentals), we see minimal price upside for the sector as a whole. However, investors could expect an average dividend yield of 4%. I would recommend investors to be choosy in investing in to utilities. Utilities such as PPL and GXP look very attractive at their current levels. Independent power producers (IPP) I have valued merchant assets based on EV/EBITDA multiple. The average multiple for the industry is 8.3x that indicates most of the (TLN, CPN and NRG) independent power producers are trading at low levels indicating good entry point for the investors. Market Current P/E Dividend Yield Regulated Utilities Cap, $bn Price, $ 2015E 2016E 2017E 2015E 2016E 2017E American Electric Power Co Inc AEP 27.2 55.56 15.8x 15.0x 14.2x 4.5% 3.9% 3.9% Consolidated Edison Inc ED 17.8 60.81 15.4x 15.2x 14.6x 4.2% 4.3% 4.4% Dominion Resources Inc/VA D 40.9 68.96 18.6x 17.8x 16.9x 5.1% 4.9% 4.6% DTE Energy Co DTE 13.9 77.51 16.7x 15.8x 14.8x 3.6% 3.8% 4.1% Duke Energy Corp DUK 51.4 74.37 15.9x 15.1x 14.3x 4.4% 4.5% 4.7% Edison International EIX 18.9 57.95 16.1x 14.9x 13.8x 2.9% 3.2% 3.6% Eversource Energy ES 14.9 46.89 16.4x 15.4x 14.6x 3.6% 3.8% 4.1% Great Plains Energy Inc GXP 3.9 25.30 16.7x 13.8x 13.3x 4.0% 4.3% 4.7% NextEra Energy Inc NEE 45.1 101.64 18.0x 16.7x 15.8x 3.0% 3.3% 3.5% PG&E Corp PCG 24.5 51.12 14.8x 13.5x 13.7x 3.6% 3.8% 4.1% Pinnacle West Capital Corp PNW 6.7 60.32 15.7x 15.0x 14.3x 4.0% 4.2% 4.4% PPL Corp PPL 20.7 31.03 14.2x 13.6x 13.3x 4.9% 5.0% 5.1% Southern Co/The SO 39.4 43.36 15.3x 14.8x 14.3x 5.0% 5.2% 5.3% TECO Energy Inc TE 4.3 18.44 16.8x 15.6x 14.5x 4.9% 5.0% 5.1% Westar Energy Inc WR 4.8 36.56 16.3x 14.9x 14.5x 3.9% 4.1% 4.4% Average 16.2x 15.1x 14.5x 4.1% 4.2% 4.4% EV/EBITDA Dividend Yield Independent Power Producers 2015E 2016E 2017E 2015E 2016E 2017E Calpine Corp CPN 6.5 17.37 8.9x 8.8x 8.5x NRG Energy Inc NRG 7.3 21.76 8.4x 8.8x 9.5x 2.7% 3.0% 3.3% Talen Energy TLN 2.2 17.26 7.3x 7.4x 7.8x Average 8.2x 8.3x 8.6x 2.7% 3.0% 3.3% Source: Google Finance Disclosure: I/we have no positions in any stocks mentioned, and no plans to initiate any positions within the next 72 hours. (More…) I wrote this article myself, and it expresses my own opinions. I am not receiving compensation for it (other than from Seeking Alpha). I have no business relationship with any company whose stock is mentioned in this article.