Scalper1 News
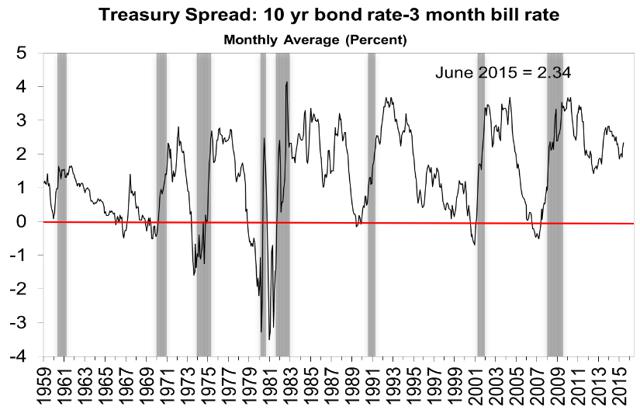
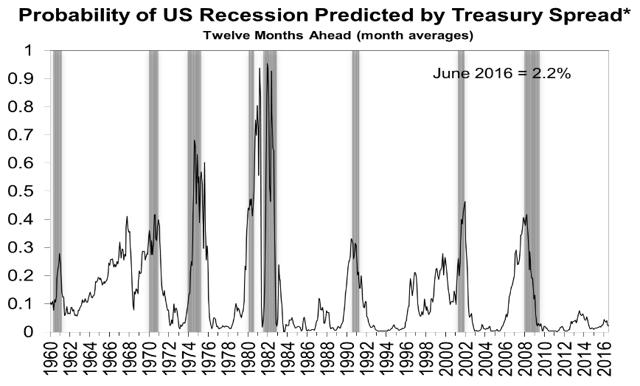
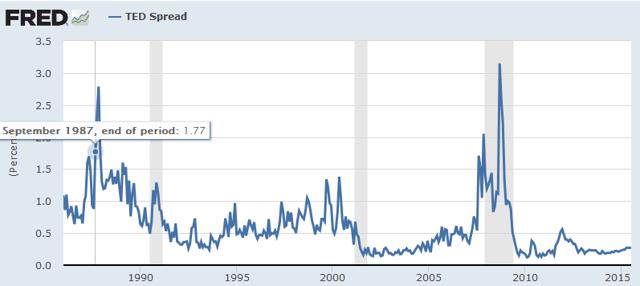
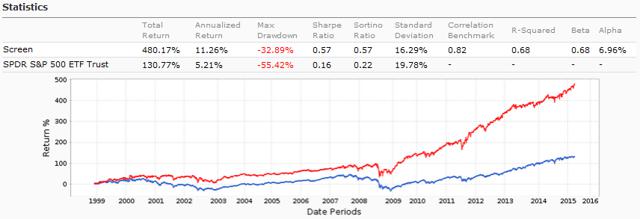
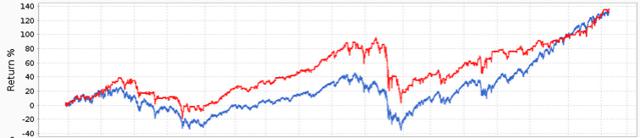
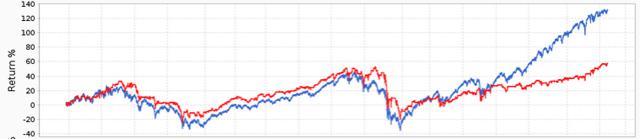 Summary This is part of a research on systemic market indicators. A summary on two rate spreads and the VIX index used as market timing indicators. A reminder of a 4-component systemic indicator presented in a former article. MTS (Multi-Timing Scores) are systemic aggregate indicators, focused on a long-term investing horizon and including the 4 main categories of market analysis: sentiment, economy, fundamentals, technicals. MTS10 is used in GHI Premium Service to send market timing alerts and size a hedge according to the systemic risk. A GHI subscriber asked me if adding parameters on credit spreads and volatility might improve it. Here is a summary of my thoughts on 3 related indicators. 10-year / 3-month spread Yield curve inversion (when long-term yields fall below shorter-term yields) has been studied in academic publications as a predictor of economic recessions in the US and other countries. The most studied data in the U.S. is the spread between rates of the 10 year bond (NYSEARCA: IEF ) and the 3 month bill (NYSEARCA: BIL ). It has worked quite well to predict recessions since 1960, with only 1 miss (the spread didn’t cross the zero line before 1960 recession) and two false signals in 1966-67. However, it gives little information about the timing. It just tells that a recession may happen in the next 6 to 20 months. Moreover, the signal (negative spread) may have disappeared before the recession really starts. It looks useful for economists and politicians, but of little help for investors. (click to enlarge) Source: New York FED As the average elapsed time between a negative spread and a recession is about 1 year, some economists have inferred a probability of recession 12 months ahead. This method predicts a probability of recession below 5% until June 2016. (click to enlarge) TED Spread The TED spread is the difference between the 3-month LIBOR and the 3-month U.S. T-bill rate. For this one, a spike is a bad omen. It did a good job at “predicting” the 1987 crash (in fact I doubt that someone was interested in it at this time) and the 2008 recession. But it was late in 1990, gave a bunch of false signals, missed the 2001 recession, and gave a late signal in 2011 during the latest meaningful market correction. (click to enlarge) Source: Saint Louis FED VIX index The VIX index measures an aggregate implied (expected) volatility on S&P 500 stocks calculated from their options. It is known as the “fear index” and may be seen as an indicator of the cost of insurance against a large market move. It usually goes up when stock indices go down. The VIX can be traded using futures, options and ETNs ( VXX , VXZ ). Two of its most interesting properties are: an attraction to its moving averages a higher probability to go up again after a day up The risk increases when the VIX goes away from its average to the downside (a sign of possible complacency) or to the upside (a sign of nervousness). It is easier to put a trigger on the downside because both properties above play in the same direction. They are opposite when the VIX goes up, making the game riskier. The next chart represents the equity curve of investing in SPY , and going in cash when the VIX is below 2% under its 10-day simple moving average (benchmark in blue is SPY “buy-and-hold”). The choice of a 10-day sma is not random, it is well-known by traders interested in the VIX. (click to enlarge) Source: portfolio123 The chart looks great, but there are a lot of intra-week signals. Global Household Index is weekly. The performance of a weekly signal is much less attractive: (click to enlarge) It is even worse with a 0.1% rate for transaction cost ($10 for $10k): (click to enlarge) I think the VIX may be very useful in setups for swing-traders, much less for investors with a mid-term or long-term horizon. This is not an original idea: in this article Mark Hulbert came to the same with other arguments. Conclusion : The 10-year / 3-month credit spread is a good recession predictor, but not a good timer. The TED spread has given timely qualitative signals twice in the past, but signals were late, missing or flawed in other cases. I didn’t find a way to use it in a quantitative indicator. The VIX index gives signals that can be used as confirmations by traders, but doesn’t seem to be a great help for investors working in weekly or longer time units. I don’t plan to integrate these indicators in my market timing scores. MTS10 components cannot be disclosed here. Interested readers can use for non-commercial purposes ( CC BY-NC 4.0 International License ) an open-source variant with 4 indicators (MTS4). It is less robust and more sensitive to economic data revisions. The component indicators are S&P 500 companies’ average short interest (bearish when the 52-week sma is above the 104-week sma); unemployment (bearish when above its value 3 months earlier); S&P 500’s current-year EPS estimate (bearish when below its value 3 months earlier); and S&P 500’s price (bearish when the 50-day sma is below the 200-day sma). When all four are bearish, it’s time to go in full hedge. This page explains how to get a limited free access to MTS4 in a popular screener, backtest it and get its value at any time. Disclosure: I/we have no positions in any stocks mentioned, and no plans to initiate any positions within the next 72 hours. (More…) I wrote this article myself, and it expresses my own opinions. I am not receiving compensation for it (other than from Seeking Alpha). I have no business relationship with any company whose stock is mentioned in this article. Scalper1 News
Scalper1 News